Curated OER
Applied Science - Science and Math Lab
Students make a prediction. For this applied science lesson, students guess the number of items in a jar. Students create a bar graph to show the predictions and the actual amounts.
Curated OER
Fast Food Survey Using Bar Graphs
Second graders create a bar graph to pictorically represent the data collected from a survey of students. They use Excel to electronically create the graphs and data tallies. They then interpret their data using sentences to explain.
Curated OER
Are You Full of Hot Air?
Explore the concept of measuring and recording circumference. In this physical science and measurement lesson, young learners blow up balloons, measure the circumference, and record the data on an interactive graphing website.
Curated OER
When Dinosaurs Ruled the World
Students graph the varying sizes of dinosaurs. In this math and dinosaur activity, students view dinosaur models and compare the different shapes and sizes of the dinosaurs. Students complete a dinosaur math activity, read The Dinosaur...
Curated OER
Climate Comparison
Students explore climate regions. In this climate activity, students examine the climate regions of Alaska as well as the state of Hawaii. Students research selected Internet sources to gather information regarding the climates present...
Curated OER
Do new kinds of insects appear after soil modification?
Students explore and experiment with the concept do new kinds of insects appear after soil modification. They assess and review scientific methods of observation, predicting, variables, math skills, ratio, proportions, graphs and the art...
Curated OER
Light Plants and Dark Plants, Wet Plants and Dry Ones
Students plant sunflower seeds in plastic cups, and once germinated, these are exposed to different conditions of light levels and/or soil moisture contents. Students measure growth of the seedlings every few days using non-standard...
Curated OER
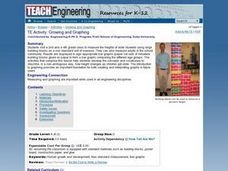
Growing and Graphing
Pupils visit a 2nd and a 4th grade class to measure the heights of older students using large building blocks as a non-standard unit of measure. They can also measure adults in the school community. Results are displayed in...
Curated OER
Chucky Chickadee's Bird and Breakfast: Sing in Please
Students observe bird feeding and complete a tally and graphing activity for their observations. In this bird graphing lesson, students work in teams to observe bird feedings. Students complete a bird reporting sheet and collect data...
Curated OER
Parachute Drop
Learners will have fun creating a parachute to collect data with. They will construct the parachute in small groups, measure the materials, and create an observation sheet. Then they drop the parachute and make predictions about how long...
Curated OER
Go The Distance Car Construction
Learners build and program a car to drive a specific challenge distance.They must at the end of the lesson, have the car that stops the closest to a challenge distance.
National Park Service
Rock Ranking
Junior geologists sort rocks and soil. They separate a sample of river gravel by size, shape, color, and other characteristics. To include Common Core standards, you could have little ones graph the number of particles in each sample.
Curated OER
Saving Money Through Mathematics
Third graders discuss light sources and collect data about energy sources. They compare data and create a multiple line graph showing energy used by light sources for each student in the group. They present their graphs and write a...
Curated OER
Comparison of Snow Cover on Different Continents
Students use the Live Access Server (LAS) to form maps and a numerical text file of snow cover for each continent on a particular date. They analyze the data for each map and corresponding text file to determine an estimate of snow cover...
Curated OER
Pond Theme Unit
For this pond theme worksheet students research facts on pond life. Students complete comprehension questions, crosswords, word search, and math puzzles. Students write a short report.
Curated OER
Heat and Matter
Students explore liquids and solids by conducting in class experiments. In this matter lesson, students define the properties of matter and how heat can change those properties. Students experiment with heating objects such as butter and...
Curated OER
Predicting Temperature: An Internet/Excel Learning Experience
Third graders use the Internet (www.weather.com) to find the high temperature for our locale and the high temperature for another city around the world. They keep track of the temperature in these two locations for 10 days.
Curated OER
Car Maze competition
Students use graphs to calibrate an RCX car. They must then program the car to traverse a maze using their calibrations
Curated OER
Who Needs What?
Students identify the physical needs of animals and if plants need the same things as animals. They conduct an experiment to see if plants need light and water to grow. They compare the growth of the plants exposed to the different...
Curated OER
Graph and Compare the Adventure's Temperature Vs. Local Temperature
Students explore the concept graphing data. In this graphing data lesson, students use weather data from their local weather and some other city and graph them. Students plot the local weather vs. another city. Students record...
Curated OER
Graphing Inertia: An Oxymoron?
Eighth graders investigate Newton's Law of Inertia in order to create a context for the review of the use of different types of graphs. They practice gathering the data from an experiment and put it into the correct corresponding graph.
Howard Hughes Medical Institute
What van Leeuwenhoek Saw
When van Leeuwenhoek saw cells and single-celled organisms for the first time, he knew these small things were a big deal! Share his discoveries with young learners through a narrated video, model-building activity, and scale study....
Curated OER
Water-The Liquid Gold
Students investigate the necessity of water for the survival of plants, animals, and people. They explore the affect that water has on human and natural environments through literature, field trips, and discussions.


