Curated OER
Graphing Quadratic Functions
In this graphing quadratic functions instructional activity, students create a function table and graph quadratic functions. This four-page instructional activity contains 33 problems. A graph is supplied with each function. One example...
Curated OER
Graphs
In this graphing worksheet, 9th graders read one page of graphing examples and complete 8 exercise problems. Each problem involves graphing and coordinates.
Curated OER
Intro to the Coordinate Plane
Students identify the axes, quadrants of the coordinate plane and plot points on the plane. They take notes on the coordinate plane. Students and teacher go over examples of the coordinate plane. As an independent practice students...
Curated OER
Comparing Data on Graph A and Graph B
Second graders gather and graph data. In this graphing lesson plan, 2nd graders collect data and graph this information using tally charts, bar graphs, pictographs, or tables. They make predictions about the outcomes.
Curated OER
Graphs of Parabolas
In this graphs of parabolas worksheet, 10th graders solve 10 different problems that include the graphs of various parabolas. First, they graph the parabola given the equation to determine which way the parabola opens. Then, students...
Curated OER
Info. From a Graph
In this graphing worksheet, students answer 13 questions about 3 graphs. Students determine the degree, roots, y-intercepts, inflection points, multiplicity, etc. of three different graphs.
Raytheon
Equations and Graphing Review
For this equations and graphing review instructional activity, learners write, graph and solve equations for 62 problems, including a mid-unit review, with answers included.
Raytheon
Graphing: Slope
For this slope worksheet, students complete problems having to do with slope including adding integers, graphing, finding ordered pairs, and more. Students complete 55 problems.
Curated OER
A Sum of Functions
Collaborative learners will see the geometric addition of functions by graphing the sum of two graphed curves on the same coordinate plane. This task then naturally flows into giving learners the algebraic representation of the curves...
Curated OER
Pre-Calculus Review Sheet
Pre-Calculus has some detailed formulas involved and here is a great resource that lumps then all together for you. Broken up into rectangular, polar, and parametric sections, the conics all include formulas and graphs.
K20 LEARN
Airplanes and Airstrips, Part 2
Table the decision to land. Pupils form flight crews by matching up different representations of linear equations. Given a set of coordinates for an airstrip, the crews determine the equation of the line that will position their planes...
College Board
2007 AP® Calculus BC Free-Response Questions
Provide a review for the exam so individuals don't tank. AP® provides the free-response questions for teachers to use to help their pupils prepare for the exam. The six BC questions from 2007 include regions bounded by functions, water...
Curated OER
Graph Figures From Equations
Students explore the concept of graphing figures from equations. In this graphing lesson, students use Microsoft Math to graph figures from equations and write equations from graphed figures.
Curated OER
Coordinate Geometry
Grab your class and get them graphing polygons on a coordinate plane! They investigate the four quadrants, discover the x and y axis, and correctly plot ordered pairs. To show their comprehension, each child creates a coordinate picture...
Shodor Education Foundation
Graphing and the Coordinate Plane
Ready to introduce your class to the coordinate plane? This website includes a detailed lesson plan that includes two interactive games to help learners practice graphing ordered pairs. The scripted discussion is a little cheesy and a...
Curated OER
Impossible Graphs
Students practice plotting functions on the Cartesian coordinate plane while participating in a discussion about the Possible Or Not worksheet/activity. Students also use the Impossible Graphs worksheet to practice reading a graph,...
Curated OER
Graphing And Data Presentation
Students engage in a study of science and mathematics with the practice of creating graphs. A guest speaker comes to the class to share statistics from the community and the students are shown how he uses the coordinate system in the...
Curated OER
Graphing Quadratic Equations
Review the form of a quadratic function, and the parabola it creates. Continue on with the whole group to work through a mini-lab, practicing how to graph quadratic equations with one variable. The goal of this lesson is for the group...
Curated OER
Graphing Linear Equations with Two Variables
Can your class solve linear equations in two variables? They will be able to after they engage in this lesson. Individuals graph linear equations in two variables using slope and intercept and identifying the relationship between the x...
Curated OER
Graphing Quadratic Equations with a Coefficient of One
This is a teacher page for a lesson and does not include any materials to support the lesson. Students graph quadratic equations with a coefficient of one and create a table of values to graph a quadratic equation. They plot the values...
Curated OER
Exponential Functions
In this algebra worksheet, students compute 4 functions for a given value. They graph 4 functions, and write equations for two graphs. Each function has an exponent as the variable.
Curated OER
Transformations on the Coordinate Plane
Here is a study guide on transformations that includes reflections, translations, dilations, and rotations. It also has definitions, helpful diagrams, and several examples involving transformations on the coordinate plane. The lesson...
Curated OER
Choose The Appropriate Graph
Fifth graders work in groups to investigate the proper use of a graph during a schoolyard ecology project. The challenge of the project is for students to choose the proper form of a graph. They gather data and conduct analysis with the...
Illustrative Mathematics
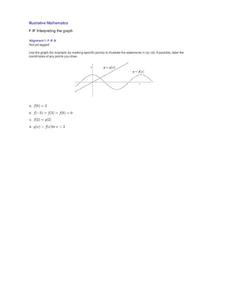
Interpreting the graph
The purpose of this exercise is to give practice in reading information about a function from its graph. Learners are given graphs of two functions on the same axes. The task is to locate and label various key points on the graph that...


