Education Development Center
Geography of the Coordinate Plane
Put the graph into graphing and allow learners to understand the concept of point plotting and how it relates to data. The worksheet provides a nice way to connect data analysis to a graph and make predictions. The worksheets within the...
Inside Mathematics
Graphs (2007)
Challenge the class to utilize their knowledge of linear and quadratic functions to determine the intersection of the parent quadratic graph and linear proportional graphs. Using the pattern for the solutions, individuals develop a...
Curated OER
Graph Picture (Coordinate Pairs) 2
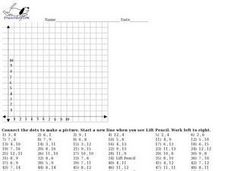
Looking for an engaging way to encourage your class to practice graphing coordinate pairs? This might be the activity you are looking for! For this activity, learners create a picture by plotting 54 coordinate pairs on graph and then...
Inside Mathematics
Graphs (2006)
When told to describe a line, do your pupils list its color, length, and which side is high or low? Use a worksheet that engages scholars to properly label line graphs. It then requests two applied reasoning answers.
BW Walch
Creating and Graphing Linear Equations in Two Variables
This detailed presentation starts with a review of using key components to graph a line. It then quickly moves into new territory of taking these important parts and teasing them out of a word problem. Special care is taken to discuss...
Kuta Software
Points in the Coordinate Plane
Keep young mathematicians on point with this coordinate plane worksheet. From plotting ordered pairs to identifying the quadrant and coordinates of specific points, this resource covers all the basic skills learners need to have when...
EngageNY
Transformations of the Graphs of Logarithmic and Exponential Functions
Transform your lesson on transformations. Scholars investigate transformations, with particular emphasis on translations and dilations of the graphs of logarithmic and exponential functions. As part of this investigation, they examine...
EngageNY
Graphs Can Solve Equations Too
There are many equations Algebra I students are not ready to solve. Graphing to solve gives them a strategy to use when they are unsure of an algebraic approach to solve the problem. The lesson exposes learners to a wide variety of types...
West Contra Costa Unified School District
Graphing Exponential Functions
Once you know how to graph y = b^x, the sky's the limit. Young mathematicians learn to graph basic exponential functions and identify key features, and then graph functions of the form f(x) = ab^(x – h) + k from the function f(x) = b^x.
National Council of Teachers of Mathematics
Stitching Quilts into Coordinate Geometry
Who knew quilting would be so mathematical? Introduce linear equations and graphing while working with the lines of pre-designed quilts. Use the parts of the design to calculate the slope of the linear segments. The project comes with...
Curated OER
Graphs
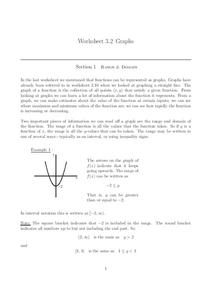
In this graphs worksheet, students solve and complete 15 various types of problems. First, they determine the range of the function of the graph shown and write in interval notation. Then, students find the domain of the function in the...
Houghton Mifflin Harcourt
Graphs from Patterns
Fifth graders analyze patterns and begin looking at function tables. This is a pertinent preparation for graphing patterns. In fact, consider giving your class a piece of graph paper and then teach them how!
EngageNY
Drawing the Coordinate Plane and Points on the Plane
To plot a point in the coordinate plane, you first need a coordinate plane. Pupils learn to draw an appropriate set of axes with labels on a coordinate plane. They must also determine a reasonable scale to plot given coordinate pairs on...
Curated OER
Coordinates
For beginning point plotters, these graphs give a good introduction. They examine a graph with shapes drawn onto it and each vertex labeled. There are 20 total, and scholars write the coordinates of each labeled point. All of these are...
Math Drills
Thanksgiving Cartesian Art: Mayflower
How did the Pilgrims arrive to America? Middle schoolers graph ordered pairs on a coordinate system, connect the points, and discover a mystery picture—the Mayflower.
Math Drills
Halloween Cartesian Art
Jack-o-lanterns are the face of Halloween. Middle school mathematicians graph coordinates on a cartesian plane and connect the points to create a jack-o-lantern.
Math Drills
Christmas Cartesian Art Holly
Happy Holly Days! Get the class graphing points on a coordinate plane with a worksheet that turns ordered pairs into works of Cartesian art.
EngageNY
Problem Solving and the Coordinate Plane
Class members investigate rectangles on the coordinate plane. They determine the length of line segments in the coordinate plane with the same x-coordinate or same y-coordinate and then solve geometric problems involving perimeter and...
EngageNY
Locating Ordered Pairs on the Coordinate Plane
Four quadrants, four times the fun. Future mathematicians learn the terminology associated with the coordinate plane and how to plot points in all four quadrants. A worksheet tests their understanding of the material in the 16th...
Charleston School District
Graphing Functions
How do letters and numbers create a picture? Scholars learn to create input/output tables to graph functions. They graph both linear and nonlinear functions by creating tables and plotting points.
Math Drills
Christmas Cartesian Art Tree
Spruce up graphing practice with an activity that has young mathematicians plot points on a coordinate plane, and then connect the points to create a Christmas tree.
EngageNY
The Graph of a Linear Equation in Two Variables Is a Line
Show your class that linear equations produce graphs of lines. The 20th segment in a unit of 33 provides proof that the graph of a two-variable linear equation is a line. Scholars graph linear equations using two points, either from...
EngageNY
Every Line is a Graph of a Linear Equation
Challenge the class to determine the equation of a line. The 21st part in a 33-part series begins with a proof that every line is a graph of a linear equation. Pupils use that information to find the slope-intercept form of the equation...
US Department of Commerce
Looking at Numbers of Births Using a Line Graph
Was there a baby boom? Using census data, class members take a look at the number of 8-11 year olds and determine their birth years. Scholars create a double line graph to compare the number of births for two states for several years....


