Curated OER
Translation of Shapes
Geometers graph figure translations, find coordinates for transformed figures, and write rules to describe transformations presented. The 2-page worksheet contains 14 problems, with answer key attached.
Curated OER
Linear and Quadratic System
Learners find the common point of a linear and quadratic system given a graph of the system. Then they find a specific point located only on the parabola.
Illustrative Mathematics
Walk-a-thon 2
During a walk-a-thon your learners must determine the walking rate of Julianna's progress. Using tables, graphs, and an equation, they must be able to calculate the time it took her to walk one mile and predict her distance based on the...
5280 Math
Capture the Points
Play a game of capture the points. Young scholars receive a number line with specific points graphed and must write an inequality that captures all the points. The second task of the algebra project is to write an inequality with...
EngageNY
Analyzing Residuals (Part 1)
Just how far off is the least squares line? Using a graphing calculator, individuals or pairs create residual plots in order to determine how well a best fit line models data. Three examples walk through the calculator procedure of...
Alabama Learning Exchange
Bloodstain Pattern Doesn't Lie......
An interesting instructional activity on hypothesizing about the diameter of a drop of blood that is splattered. To test their theories, learners work in groups to make blood droplets splatter from different heights. They use graphed...
Curated OER
Find Parabolas through Two Points
Your learners will write quadratic functions whose graphs include specific points and explore how these graphs are related to each other.
Curated OER
Slope-Intercept Form of a Line
Using the subscriber website Explorelearning.com, young mathematicians observe changes in the slope and y-intercept and their effect on the graph of lines. This activity helps middle schoolers develop an intuitive sense of the connection...
Illustrative Mathematics
Influenza epidemic
This activity presents a real-world problem about an epidemic of influenza spreading through a city. Learners refer to a graph that shows the number of individuals infected in relation to the number of weeks that have elapsed since...
Illustrative Mathematics
Coffee by the Pound
This is a great exercise in graphing proportional quantities to interpret the unit rate as the slope of a graph. It is not easy for learners to understand what a unit rate is. When it is presented as the slope of a linear line graph,...
5280 Math
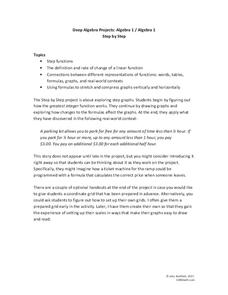
Step by Step
One step at a time! A seemingly linear relationship becomes an entirely new type of function. Young scholars build their understanding of step functions by completing a three-stage activity that incorporates multiple representations of...
Curated OER
Exploring Transformations
Young scholars explore what happens when geometric figures are transformed on the coordinate plane. They work in pairs, moving geometric shapes in the plane, and formalize their rules as functions.
Illustrative Mathematics
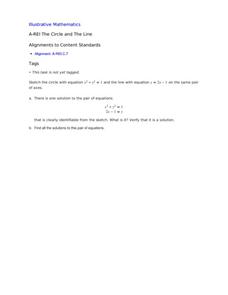
The Circle and The Line
Here is a resource where algebra learners show their understanding of a system of equations involving a circle and a line. Once graphed, learners see two points of intersection, one where the ordered pair is read, and a second where...
Illustrative Mathematics
Find the Change
This exercise is an opportunity for algebra learners to understand the connection between the slope of a line and points found on the line. Use similar triangles to explain why slope m is the same between any two points. Discuss with the...
EngageNY
The Computation of the Slope of a Non-Vertical Line
Determine the slope when the unit rate is difficult to see. The 17th part of a 33-part series presents a situation that calls for a method to calculate the slope for any two points. It provides examples when the slope is hard to...
Curated OER
Algebra 1: Slope as Rate
Young scholars solve problems with slopes. In this algebra instructional activity, students identify the slope of a line and relate it to the rate of change. They graph their lines on the TI and observe changes in the lines.
Shodor Education Foundation
Sequencer
Take the first step into graphing sequences. Learners set the starting number, multiplier, add-on, and the number of steps for a sequence. Using the inputs, the interactive calculates and plots the sequence on the coordinate plane. Users...
Curated OER
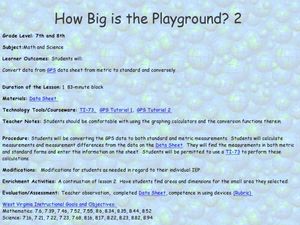
How Big Is The Playground?
Students calculate the standard and metric measurements of a playground. In this measurement lesson plan, students use GPS coordinates and graphing calculators to determine the dimensions of an area outside of the school in both standard...
Illustrative Mathematics
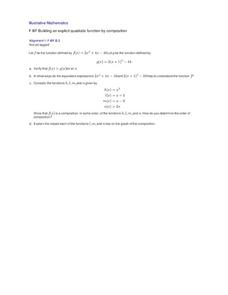
Building an Explicit Quadratic Function by Composition
Use an activity to illustrate the different forms of a quadratic function. Here, the task asks learners to use composition of given functions to build an explicit function. The process emphasizes the impact of the order of...
Achieve
Dairy Barn
Agriculture is truly a math-based profession! Help the dairy farmer determine the supplies needed to complete his barn. Using given dimensions, learners build equations and use units to determine the correct amount of materials.
Curated OER
Building a General Quadratic Function
Learners rewrite a general quadratic function by completing the square to see a new form of the function that more easily identifies the x-coordinate of the vertex and the two roots of the function.
EngageNY
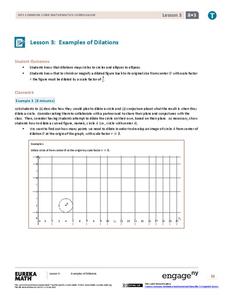
Examples of Dilations
Does it matter how many points to dilate? The resource presents problems of dilating curved figures. Class members find out that not only do they need to dilate several points but the points need to be distributed about the entire curve...
SHS Algebra
Linear vs. Exponential Functions Tasks
Your algebra learners will enjoy the real-life application of the three tasks presented here. They complete a table and a graph comparing the two options presented. One option is linear, while the other is exponential. After coming up...
Concord Consortium
Writing and Sketching I
Writing and sketching functions—what more could you want to do? Learners write and sketch functions that meet certain conditions as they complete a short task. They find a parabola that encompasses three quadrants of the coordinate plane...


