Curated OER
Scatterplots
Students evaluate equations and identify graphs. For this statistics lesson, students identify plotted points on a coordinate plane as having a positive, negative or no correlation. They complete basic surveys, plot their results and...
Curated OER
Writing and Graphing Functions
Students explore mathematics by completing a graphing assignment in class. In this math functions lesson, students practice graphing X and Y coordinates on a graph and checking their work with partners. Students complete more graphing...
Curated OER
Trigonometry Worksheet: Graph Trigonometric Functions (1)
For this trigonometry worksheet, students graph one trigonometric function. The function is y=2cos(2x). A coordinate grid is included on the worksheet.
Curated OER
Applications of Properties of Quadrilaterals in the Coordinate Plane
Students explore the concept of quadrilaterals. In this quadrilaterals instructional activity, students use the slope formula, midpoint formula, and distance formula to justify that a given quadrilateral is a parallelogram.
Curated OER
Impossible Graphs
Students distinguish between possible and impossible graphs of functions, and to learn why some graphs are impossible. They have practiced plotting functions on the Cartesian coordinate plane
Curated OER
Graphing Integers On a Coordinate Plane
Seventh graders explore the concept of graphing integers on a coordinate plane. In this graphing integers on a coordinate plane instructional activity, 7th graders discuss scenarios where coordinate systems are used in real life. ...
Curated OER
Cartesian Coordinate System
Students research the Cartesian Coordinate System and its many uses in the world of mathematics and algebra.
Curated OER
Graphs and Ellipses
Students explore linear graphs, the parabola and the rectangular hyperbola.
Curated OER
Geometric Coordinates
In this geometric coordinates activity, students solve and complete 3 different types of problems. First, they use the equations provided to complete the table on the right. Then, students plot the x- and y- coordinates on the graph to...
Curated OER
Usage and Interpretation of Graphs
Young scholars review graphing and use processing skills to solve problems.
Curated OER
Pet Count Excel Graphing
Students used collected data to distinguish what pets they have or would like to have. They correlate findings with appropriate technology--Excel. At the end of the lesson they tabulate a bar chart and present their findings to the class.
Pennsylvania Department of Education
Using the Coordinate Plane in Problem Solving
Fifth graders practice solving problems. In this fraction and decimal lesson plan, 5th graders recognize the relationship between fraction and decimals. Students estimate problem results and write expressions to use for problem solving.
Curated OER
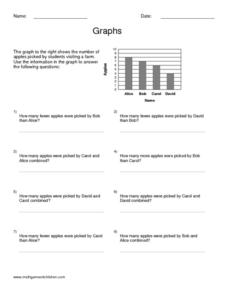
Graphs
In this algebra worksheet, students calculate the point of intersection between a circle and a straight line. There are 5 questions with an answer key.
Curated OER
Graphing Polar Coordinates
Students define polar equations and learn to plot them. For this calculus lesson, students relate polar equations to real life scenarios such as plants and comic strips. They discuss and define the curves of polar equations.
EngageNY
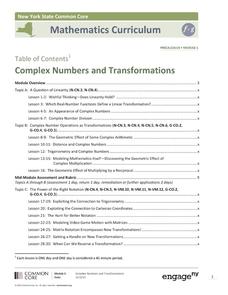
Complex Numbers and Transformations
Your learners combine their knowledge of real and imaginary numbers and matrices in an activity containing thirty lessons, two assessments (mid-module and end module), and their corresponding rubrics. Centered on complex numbers and...
Curated OER
Matrix Madness!!
Perform operations to add, subtract, multiply and divide matrices. Then solve problems with vectors using matrices. A three day activity: Matrix Madness, Mystical Matrices, and Decode the Encode. The last activity has prizes that the...
EngageNY
Finding Systems of Inequalities That Describe Triangular and Rectangular Regions
How do you build a polygon from an inequality? An engaging lesson challenges pupils to do just that. Building from the previous lesson in this series, learners write systems of inequalities to model rectangles, triangles, and even...
West Contra Costa Unified School District
Sneaking Up on Slope
Pupils determine the pattern in collinear points in order to determine the next point in a sequence. Using the definition of slope, they practice using the slope formula, and finish the activity with three different ways to determine the...
Curated OER
The Sum of Our Integer Intelligences
Young mathematicians explore integers. They review adding integers through engaging in mathematical labs. Each lab station is designed to reflect one of the multiple intelligences. Resources for all activities are provided.
Curated OER
Location on a Grid
There are 12 symbols on this large grid, and scholars must record a location for each. They use the coordinate pair system which is made easier because every symbol is directly inside a square. Use this to introduce coordinate pair...
EngageNY
End-of-Module Assessment Task - Algebra 2 (Module 3)
The last installment of a 35-part series is an assessment task that covers the entire module. It is a summative assessment, giving information on how well pupils understand the concepts in the module.
Geophysical Institute
Latitude and Longitude with Google Earth
Travel the world from the comfort of your classroom with a instructional activity that features Google Earth. High schoolers follow a series of steps to locate places all over the earth with sets of coordinates. Additionally, they...
Balanced Assessment
Catenary
Develop a model for a hanging chain. Pupils find a mathematical model for a hanging chain and then they compare their models to the precise function that models the curve. Scholars come up with a strategy to determine how close their...
Rice University
Precalculus
Take a step beyond Algebra 2. Learners use the eBook to learn concepts from the typical Precalculus course. Content starts off with a short review of functions in general and moves on to the basic functions, finishing up with more...


