Bowland
My Music
Scholars investigate how the tempo of music affects heartbeats. Groups develop hypotheses about music and its connection to heartbeats before carrying out an experiment. They analyze and present data from their investigations.
101 Questions
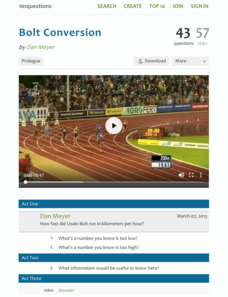
Bolt Conversion
Usain Bolt and Superman have something in common—speed! A video of one of Bolt's races introduces young scholars to the concept of unit rate. Using data from the race, the narrator calculates a unit rate in kilometers per hour, which...
American Statistical Association
More Confidence in Salaries in Petroleum Engineering
Making inferences isn't an exact science. Using data about salaries, learners investigate the accuracy of their inferences. Their analyses includes simulations and randomization tests as well as population means.
Shodor Education Foundation
Multiple Linear Regression
You'll have no regrets when you use the perfect lesson to teach regression! An interactive resource has individuals manipulate the slope and y-intercept of a line to match a set of data. Learners practice data sets with both positive and...
Curated OER
Collecting Data and Graphing
Young mathematicians collect data and graph it. They work collaboratively to collect data regarding the span of arm length versus height and graph the data they collect.
Curated OER
What's Up With My Class
Learners collect data about their class and they use Excel spreadsheet to display their tables and graphs about the class. They answer survey questions and collect their data. Students create a graph of their choice to display the...
Curated OER
Graphing the Past Using Today's Technology
Eighth graders research statistical data regarding their current social studies unit. They write questions about the measures of central tendency, collect and analyze the data, insert the data into a spreadsheet, and generate graphs.
Curated OER
Math: Football Fever Fun
Students compile statistics from high school or other football team and construct a spreadsheet on which to record their findings. Using Chart Wizard to analyze the data, they construct charts and graphs for a visual display of the...
University of Georgia
Using Freezing-Point Depression to Find Molecular Weight
Explore the mathematical relationship between a solvent and solute. Learners use technology to measure the cooling patterns of a solvent with varying concentrations of solute. Through an analysis of the data, pupils realize that the rate...
Curated OER
Mrs. Lewis's Pets: Tally Mark Activity
To cute to pass up! This slide show activity has learners count the number of pets Mrs. Lewis has using tally marks. As the show progresses, kids pay attention and make a tally for each type of pet they see. Suggested uses and audio are...
Polar Trec
Ozone Data Comparison over the South Pole
Did you know the hole in the ozone is seasonal and filled by January every year? The lesson uses scientific measurements of the ozone over the South Pole to understand patterns. Scholars learn that the hole grew bigger annually before...
American Institutes for Research
Digital Smiles
Explore metric measurement, recording data, and creating an electronic spreadsheet displaying results with your math class. Scholars will measure the length of their smiles, record the measurements, and represent the results on an...
Curated OER
Piles of Paper
Track how much paper their class uses in a week. They will pile their used paper into one place, each day the pile is measured. They make predictions about how much paper they would collect in a month, then recycle the paper.
Radford University
Snappy Stair Sprints
Let's go for a run. Small groups determine a way to collect data to determine the time it would take to run a set of stairs. After creating a plan, teams collect data and graph their results, calculating the equation of best fit and...
US Department of Commerce
Creating and Taking a Survey
Individuals learn how to conduct surveys and collect data for the class on age, pets, and number of people at home. Scholars compare their household size to the information in the census. Pupils then develop additional questions to ask...
Math Worksheets Land
Patterns of Association (Using Data Tables) - Guided Lesson
The worksheet belongs to a four-part resource that applies percentages to data tables. The page has three practice problems that continues with the development of this topic.
101 Questions
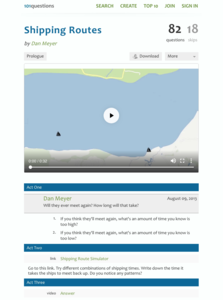
Shipping Routes
The product of the hard work is learning. Scholars use a simulation tool to collect information to analyze. They must decide when two ships traveling back and forth across a river at different rates will meet on the same side. The intent...
Public Schools of North Carolina
Math Stars: A Problem-Solving Newsletter Grade 4
Fresh off the press, these math newsletters will challenge the problem solving skills of your young mathematicians. With an incredibly wide variety of questions covering the topics of arithmetic and geometry, these unique...
Curated OER
Fish Communities in the Hudson
Learning to read data tables is an important skill. Use this resource for your third, fourth, or fifth graders. Learners will will study tables of fish collection data to draw conclusions. The data is based on fish environments in the...
Intel
Forensics: Get a Clue
Although the methods are all scientific, forensic science was started by police officers rather than scientists, who relied on observation and common sense. Young detectives use many tools to solve crimes around the school in a...
Curated OER
Data Analysis
Twelfth graders collect and analyze data. In this secondary end-of-course mathematics lesson, 12th graders formulate a question they would like to answer and decide on an appropriate means of data collection. Students present their...
Curated OER
Data Analysis and Probability
Students make their own puzzle grid that illustrates the number of sit-ups students in a gym class did in one minute, then they make a histogram for this same data. Then they title their graph and label the scales and axes and graph the...
Curated OER
Bungee Jump Lab
Student apply linear relationships to the real world. They use Ken and Barbie dolls and experiment to find the line of best fit. They collect data, analyze data, and make predictions from it. The learners also use Microsoft Power Point...
Curated OER
What Color Are Your Eyes?
In this color of eyes activity, students conduct a survey to determine the number of students who have brown, hazel, blue or green eyes. The information is collected and then the data is organized. Students may use the data to create...


