Curated OER
Gathering Data to Problem Solve
Students, while using reading and writing strategies (subheads, prediction, skim, details, drawing inferences, etc,), solve math problems that involve gathering and representing data (addition, subtraction, multiplication). They practice...
Curated OER
Dealing with Data
Seventh graders collect and analyze data. In the seventh grade data analysis lesson, 7th graders explore and/or create frequency tables, multiple bar graphs, circle graphs, pictographs, histograms, line plots, stem and leaf plots,...
Curated OER
Data Handling
In this data handling worksheet, students interpret data found in table, graphs and charts. They organize data and draw bar charts. This two-page worksheet contains 2 multi-step problems.
Radford University
Sleep and Teen Obesity: Is there a Correlation?
Does the number of calories you eat affect the total time you sleep? Young mathematicians tackle this question by collecting their own data and making comparisons between others in the class through building scatter plots and regression...
American Statistical Association
You and Michael
Investigate the relationship between height and arm span. Young statisticians measure the heights and arm spans of each class member and create a scatter plot using the data. They draw a line of best fit and use its slope to explain the...
Willow Tree
Histograms and Venn Diagrams
There are many different options for graphing data, which can be overwhelming even for experienced mathematcians. This time, the focus is on histograms and Venn diagrams that highlight the frequency of a range of data and overlap of...
American Statistical Association
Tell it Like it is!
Scholars apply prior knowledge of statistics to write a conclusion. They summarize using correct academic language and tell the story of the data.
EngageNY
Modeling Relationships with a Line
What linear equation will fit this data, and how close is it? Through discussion and partner work, young mathematicians learn the procedure to determine a regression line in order to make predictions from the data.
Statistics Education Web
Who Sends the Most Text Messages?
The way you use statistics can tell different stories about the same set of data. Here, learners use sets of data to determine which person sends the most text messages. They use random sampling to collect their data and calculate a...
Discovery Education
Fuss About Dust
Dust is everywhere around us; it's unavoidable. But what exactly is dust and are certain locations dustier than others? These are the questions students try to answer in an interesting scientific investigation. Working independently or...
Bowland
Crash Test
Use mathematics and simulations to investigate car crashes. IScholars test hypotheses involving car crashes. They collect, analyze, and display data from computer simulations to support or refute their hypotheses.
Radford University
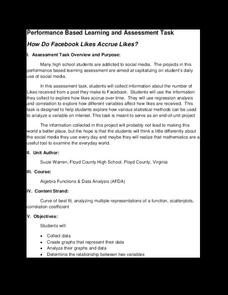
How Do Facebook Likes Accrue Likes?
Finally, a project pupils will instantly like! Young mathematicians collect data on the number of likes they receive for a social media post over time. During the first part of the project, they determine a curve of best fit and...
Achieve
BMI Calculations
Obesity is a worldwide concern. Using survey results, learners compare local BMI statistics to celebrity BMI statistics. Scholars create box plots of the data, make observations about the shape and spread of the data, and examine the...
Radford University
Discovering Quadratics
Get to know quadratics from a couple of different perspectives. Classmates work in small groups to determine the optimal cooking time for microwave popcorn. Group members pop bags of popcorn for different times and collect data on the...
Curated OER
Representing Data 2: Using Box Plots
What information can be gleaned from a box and whiskers plot? Discuss the five summary values - minimum, maximum, upper and lower quartiles, and median - and what conclusions can be made from these values? Included here is a matching...
Radford University
Animal Decline
Where did they all go? Small groups collect data on different animal species that are on a decline. Teams develop equations to model the populations over time and then create presentations about the decline of their animals. Classmates...
Radford University
Are We Normal?
Develop a sense of normal. Learners develop two questions to ask classmates to gather numerical data before creating a box and whisker plot and a histogram to display their data. Class members make inferences and investigate the data...
US Department of Commerce
Applying Correlation Coefficients - Educational Attainment and Unemployment
Correlate education with unemployment rates. Individuals compare state and regional unemployment rates with education levels by calculating the correlation coefficient and analyzing scatter plots. Pupils begin by looking at regional data...
Radford University
Tuition Cost Activity
Can I afford to go to college? Small groups design a method to research college tuition for several years and make a prediction of costs in 2025. Classmates plot the the data on a scatter plot and graph the line of best fit to make their...
Curated OER
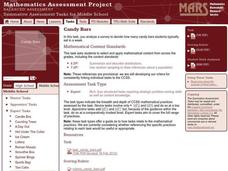
Candy Bars
There is often more to data than meets the eye. Scholars learn that they need to analyze data before making conclusions as they look at data that describes the number of candy bars boys and girls eat. They disprove a given conclusion and...
Howard Hughes Medical Institute
Spreadsheet Tutorial 4: t-Test
The t-test tutorial will fit your needs to a T. After calculating the mean, sum of squares, standard deviation, and variance of two data sets on a spreadsheet, scholars learn to calculate the t-values. They then learn to use the TTEST...
Shodor Education Foundation
Scatter Plot
What is the relationship between two variables? Groups work together to gather data on arm spans and height. Using the interactive, learners plot the bivariate data, labeling the axes and the graph. The resource allows scholars to create...
American Statistical Association
Confidence in Salaries in Petroleum Engineering
Just how confident can we be with statistics calculated from a sample? Learners take this into account as they look at data from a sample of petroleum engineer salaries. They analyze the effect sample size has on a margin of error and...
Radford University
Let's Buy a Car
Ready to buy a car? Learners research different makes and models of cars to decide on the best one to buy. They collect data on cost, fuel efficiency, safety ratings, and insurance costs, then create and analyze data displays to make...


