Curated OER
Comparing Linear and Exponential Data
Learners graph linear and exponential equations. In this algebra instructional activity, students differentiate between linear and exponential equations. They relate it to the real world.
Curated OER
What is the Best Chip?
Scholars collect data about chips. They pick their favorite type of chip from a given variety such as potato chips, tortilla, or banana chips. Then they write on an index card their favorite chip and why it's their favorite. They also...
American Statistical Association
How Tall and How Many?
Is there a relationship between height and the number of siblings? Classmates collect data on their heights and numbers of brothers and sisters. They apply statistical methods to determine if such a relationship exists.
Curated OER
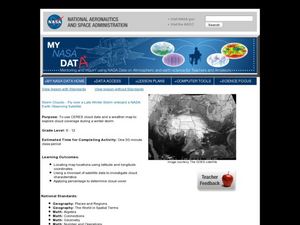
Storm Clouds-- Fly over a Late Winter Storm onboard a NASA Earth Observing Satellite
Students study cloud data and weather maps to explore cloud activity. In this cloud data lesson students locate latitude and longitude coordinates and determine cloud cover percentages.
EngageNY
Describing a Distribution Displayed in a Histogram
The shape of the histogram is also relative. Learners calculate relative frequencies from frequency tables and create relative frequency histograms. The scholars compare the histograms made from frequencies to those made from relative...
Kenan Fellows
Density
Most scholars associate density with floating, but how do scientists determine the exact density of an unknown liquid? The third lesson in a seven-part series challenges scholars to find the mass and volume of two unknown liquids. Each...
Teach Engineering
Energy on a Roller Coaster
Roll with your class into the idea of conservation of energy. Pupils use a roller coaster track to collect data to reinforce the concept of conservation of energy and the influence of friction. Class members then create a graph from...
Alabama Learning Exchange
How Old is Your Money?
Elementary learners explore coin mint dates. First, they listen to the book Alexander Who Used to be Rich Last Sunday by Judith Viorst. They then sort a collection of coins according to their mint date and put them in order from oldest...
Teach Engineering
Earthquakes Living Lab: Finding Epicenters and Measuring Magnitudes
Pairs use an online simulation to determine the epicenter and magnitude of an earthquake. Using real data about the earthquake's maximum S wave amplitudes, they then determine the magnitude. The resource provides a great career...
Radford University
Corn and Popcorn
Have a popping good time. Using probability and statistics skills, learners determine which type of popcorn to buy based on the percentage of kernels popped. After analyzing corn and popcorn sales to make a prediction of future sales,...
Radford University
Connecting Scatter Plots and Correlation Coefficients Activity
Collect a variety of bivariate data. Groups determine sets of data that would provide a positive, negative, and no correlation. Team members gather their data through out the week. Scholars plot the data and determine the relationship...
Teach Engineering
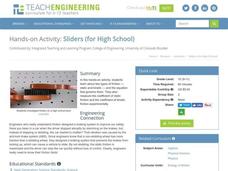
Sliders (for High School)
Slip sliding away. Groups investigates the two types of friction by running an experiment that allows them to calculate the coefficient of static friction and the coefficient of kinetic friction. The experiment uses a box, a basket, and...
101 Questions
Gas Station Ripoff
Ever wonder if you can trust the pump that pumps your gas? Budding mathematicians use video evidence to analyze the cost-per-gallon ratio at different intervals for three different pumps. Their goal is to identify the pump that is...
101 Questions
Coins in a Circle
Round and round you'll go! Learners watch as different-sized circles fill with coins. They collect data and then make a prediction about the number of coins that will fit in a large circular rug.
University of Colorado
Looking Inside Planets
Researchers use scientific data to understand what is inside each of the planets. The first in a series of six, this instructional activity builds off of that concept by having pupils use a data table to create their own scale models of...
Radford University
Are Kitchen Cabinets at the Correct Height? Lesson 6
Don't hit your head on the kitchen cabinet. Using previously collected female height data, scholars apply confidence intervals and tests of significance to perform a data analysis. They connect the data to the height
of kitchen cabinets...
Purdue University
The Represented World: Recreational STEM
How are forces and motion important to a swing set? Scholars explore the concepts of force and motion using swing sets. In preparation for their own STEM design project, individuals take surveys and data from peers, complete labs on...
Pace University
Grade 7 Earth Day Statistics with Circle and Bar Graphs
Take a tiered approach to studying waste. The lesson uses Earth Day to present differentiated instruction around using circle and bar graphs. Each group gets a cube based on their tiers and works collaboratively as well as individually...
Radford University
Are Kitchen Cabinets at the Correct Height? Lessons 1-5
Here's a not-so-normal unit on normal heights. Future statisticians anonymously collect class data on female heights, weights, and shoe sizes. They then analyze the data using normal distributions, z-scores, percentiles, and the...
Radford University
Action Bungee Jump
Drop scatter plots onto the class. Teams collect data to determine how far an action figure will fall suspended by rubber bands. Using the collected data, groups determine a line of best fit. Given a drop height, they also determine the...
Curated OER
Gathering Statistics for Research
Learners gather statistics to include in their research. In this statistics lesson, students investigate how to incorporate statistics into research and other readings besides math. They collect data based on other topics, analyze the...
Curated OER
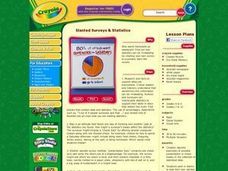
Slanted Surveys And Statistics
Students engage in a lesson plan that is concerned with the use of statistics and surveys and how they should be read. They create a survey and take it home to collect data. Then students display the data on a graph that is displayed in...
Lesson Plans
Student Info
Inform your instruction with information about your pupils. These student information pages will help you gather data about your classes. The first page focuses on educational history and preferences and the second asks for contact...
EngageNY
Newton’s Law of Cooling, Revisited
Does Newton's Law of Cooling have anything to do with apples? Scholars apply Newton's Law of Cooling to solve problems in the 29th installment of a 35-part module. Now that they have knowledge of logarithms, they can determine the decay...


