Curated OER
Popular Paper
Students explore the benefits of recycling paper. In this recycling lesson, students use statistics to calculate the amount of paper that is thrown away each week and construct a graph. Students analyze the data and calculate the...
Curated OER
Its OK To Be a Clod
Students describe factors that affect the solubility of a chemical substance in seawater. In this sea environment lesson, student explain how information on the solubility of a substance can be used to measure water currents. They will...
Curated OER
Investigation 6 - Collecting Weather Data
Fourth graders collect data for two weeks. They start seeing patterns and make predictions. They can predict what the weather be like the next day and for the next few days. They see if their predictions were correct from the previous day.
Curated OER
Basketball And Mathematics
Eighth graders collect and analyze data about foul shots taken at basketball games.
Curated OER
Introduction to Graphical Representation of Data Sets in Connection with Nuclear Decay
Students record data, make observations, and share in experimentation and discussion of numerical experiments.
Curated OER
What is the Value of the Car?
Middle schoolers practice determining the value of cars. Using the internet, they complete a worksheet in which they list the make of each car and use the data to determine the value. They share their results with the class and identify...
Curated OER
Positive Future Fair Project
Ninth graders view the film "Pay It Forward" and discuss what kind of public campaign is needed to move people to positive action. They consider different ways of presenting information (graphs, visual displays, etc.) as tools for...
Curated OER
Let's Get Physical
Students collect data using the CBL. For this statistics lesson, students predict the type of graph that will be created based on the type of activity the person does. The graph represents heart rate depending the level of activity.
Curated OER
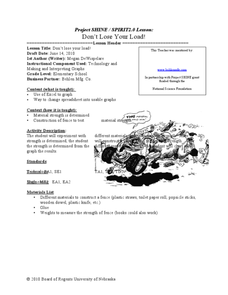
Don't Lose Your Load!
Students create graphs using collected data. In this algebra lesson plan, students use spreadsheet in Excel to create graphs to interpret their data and make predictions. They rewrite word problems using algebraic expressions.
Curated OER
What Pie?
Students practice making and interpreting pie graphs so they are better able to decide if a pie chart is the appropriate form of display. Students examine included overheads of different pie charts, and directions on how to make pie...
Curated OER
Chucky Chickadee's Bird and Breakfast: Sing in Please
Students observe bird feeding and complete a tally and graphing activity for their observations. In this bird graphing lesson plan, students work in teams to observe bird feedings. Students complete a bird reporting sheet and collect...
Alabama Learning Exchange
What do Plants Need?
Students plant seeds and watch them sprout. Once growing plants are placed in different conditions and students record data about their growth. They graph the data.
Curated OER
Graphing With Paper and Computers
Fourth graders construct bar graphs. In this graphing lesson, 4th graders create bar graphs in connection with the story, The Copycat Fish. After creating the initial graphs on paper, students use MS Excel to create graphs.
Curated OER
Chicken Pox Math
Students will listen to a story of a boy with chicken pox and participate in a class discussion of chicken pox and what to do when you have a contagious disease. They will incorporate math by graphing who in the class has had the...
Curated OER
Discovering Ohm's Law
Connect math with science! Pupils apply properties of Ohms Law as they solve problems and identify the inverse relationship of a function. They analyze the shape of the graph of an inverse function and use it to make predictions.
Curated OER
Sundials and Shadows - What Can They Teach Us About Seasons?
Pupils collect and analyze data relating to seasonal changes. They view a video, research web sites and build a sundial to collect their data.
Curated OER
Seasons and Cloud Cover, Are They Related?
Students use NASA satellite data to see cloud cover over Africa. In this seasons lesson students access data and import it into Excel.
Curated OER
Pumpkin Problems
Students participate in a lesson that has the intention of working on estimation skills. They use pumpkins to estimate the number of seeds are inside. They collect data for each pumpkin and compare it to the estimation. Students question...
Curated OER
And Now, the Weather...
Students collect and analyze data. In this middle school mathematics/science lesson, students collect temperature reading over a 24 hour period. Students analyze the data for mean, median, maximum and minimum.
Curated OER
Survey and Share
Students practice collecting data by surveying other students. In this data collection lesson plan, students decide on a question and collects data from 15 other students. Eventually the students will end up graphing their results.
Curated OER
Graphing Data
Second graders examine how to make and read bar graphs. In this bar graph lesson, 2nd graders compare bar graphs to pictographs by looking at hair color survey data. They practice making a bar graph and finding the range of the data.
Curated OER
Interpreting Data-Working with Controls and Variables
Students review the meaning of control and variables, and state difference between dependent and independent variables. They complete a worksheet with the definitions and complete problems that show their understanding.
Curated OER
Math Lesson: How Many People Live There?
Students are able to calculate the population density of a country, and calculate the population density of large cities in that country. They are able to create an appropriate graph to represent their data for that country.
Curated OER
Bubbles
Third graders perform an experiment using different mixtures of dishwasher detergent. They construct bar graphs that record their bubble data for each detergent set.


