Curated OER
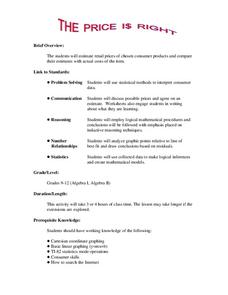
The Price Is Right
Young scholars create a list of products with estimated prices. In this algebra lesson, students learn to write equations using variables. They match their created list with that of actual products and compare their prices,
Curated OER
An Introduction to Elementary Statistics
Students explain and appreciate the use of statistics in everyday life. They define basic terms used in statistics and compute simple measures of central tendency.
Curated OER
Mass vs. Weight
Students explore physical science by conducting a measurement experiment. In this mass lesson, students identify the differences between mass and weight and define a list of other vocabulary terms. Students utilize electronic scales and...
Curated OER
Under the Weather
Students review mean, median, mode, and range while using the newspaper to answer weather questions.
Shodor Education Foundation
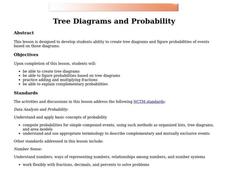
Tree Diagrams and Probability
Aspiring statisticians create tree diagrams and figure probabilities of events based on those diagrams. They practice adding and multiplying fractions and explain complementary probabilities. Students use computers activities to make...
Curated OER
Ants in Your Pants
First graders read "One Hundred Angry Ants" by Elinor Pinczes. They identify various sums that equal ten and display them on a chart.
Curated OER
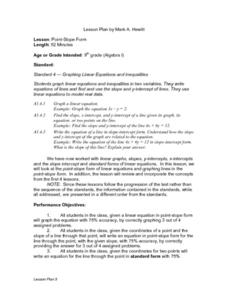
Point-Slope Form
Ninth graders explore the point-slope form of linear equations and graph lines in the point-slope form. After completing the point-slope equation, they identify the slope of a line through a particular point. Students explain the...
Curated OER
Go Fish:
Third graders imagine that they are asked to determine the number of fish in a nearby pond. To count the fish one by one, they could remove the fish from the pond and stack them to one side, or mark each fish so they would not count them...
Curated OER
Underwater Excavation
Students calculate artifact size and ship capacity based on the excavation of an ancient Roman shipwreck.
Curated OER
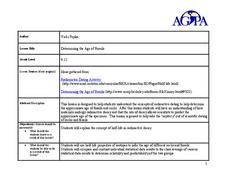
Determining the Age of Fossils
Students examine the concept of radioactive dating. In this radioactive dating lesson plan, students investigate how to determine the ages of fossils and rocks as they learn about half-life radioactive decay.
Curated OER
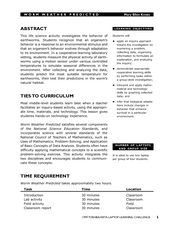
Worm Weather Predicted
Students examine worm habitats. In this animal habitats lesson, students participate in a lab activity that requires them to explore the adaptations that earthworms make to their environment.
Curated OER
Parachutes: Is it Surface Area or Shape?
Young scholars investigate how to make a good parachute. In this physics activity, students observe the motion of parachutes as it falls and measure the time. They collect data and calculate the average descent time for each canopy shape.
Curated OER
The Effects of Environment on Plant Growth: Selecting Seeds for Survival on a New Planet
Fifth graders conduct experiments to compare seed germination and plant growth rates. They construct a hydroponic plant unit and a lighthouse. They care for the plants for a month and collect data for graphs. They write a report.
Curated OER
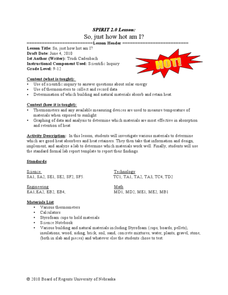
So, just how hot am I?
Young scholars design a lab demonstrating the scientific method. In this earth science lesson, students investigate different materials for their heat absorbing property. They report their findings in class.
Curated OER
Inventors Unit Survey
Students develop and conduct a survey for their inventors unit. They create a five question survey and tally the survey results, and create a graph using Microsoft Word and Graph Club 2.0.
Curated OER
Probability: Playing with Fire
Students use probability to determine how likely it is for each tree in a small forest to catch on fire.
Curated OER
Record 'The' Results
Third graders predict how many times they'll see the word "the" in a newspaper page and highlight all the "the"s they find. After reviewing definitions of range, median, mode, mean they create a Stem and Leaf Plot and a Back-to-Back Stem...
Curated OER
A Functional Housing Market
Students access the Internet to search for housing prices in Houston, Texas,(the location can be changed to accommodate any location) and compare the prices to the number of square feet found in the living area of a house.
Curated OER
Chips Ahoy A Thousand Chips In Every Bag
Sixth graders determine whether Nabico's claim to sell 1000 chocolate chips in every 1 pound bag of Chips Ahoy! is true.
Curated OER
Magic Mountain Coaster Computation
Students use the Internet to do research on the roller coasters at Magic Mountain Amusement Park. They must use mathematical formulas to calculate the highest and fastest coaster at the park.
Curated OER
Best Guesser
Fifth graders develop strategies for estimating ages, and illustrate results by graphing and interpreting scatter plots to compare x and y coordinates.
Curated OER
The Amazing Race
Seventh graders engage in a discussion to determine their experience with traveling. Ask them to describe differences in transportation, currency, culture, food, accommodation, etc. Then they discuss the different expenses one has when...
Curated OER
Stem-and-Leaf Plots
Students are introduced to stem-and-leaf plots and calculating the mean, median, and mode from the plots.


