Curated OER
Central Tendencies and Normal Distribution Curve
Fourth graders are given data (class test scores) to determine central tendencies, and find information needed to construct a normal distribution curve. They become proficient in calculating mode, median and average.
Teach Engineering
Fun with Air-Powered Pneumatics
How high did the ball go? Engineering teams build a working pneumatic system that launches a ball into the air. The teams vary the amount of pressure and determine the accompanying height of the ball. An extension of building a device to...
Radford University
The Science of Surveys
To drill or not to drill? An informative unit has scholars first research the advantages and disadvantages of oil drilling in Alaska. They set up and conduct a sample survey to assess attitudes toward oil drilling in a specific...
Curated OER
The Effect of Math Anxiety on Cardiovascular Homeostasis
Students examine the effect stress due to test anxiety may have on the heart. As part of the experiment, students hypothesize, collect data, graph data, analyze data and formulate an understanding of their personal level of stress and...
Curated OER
The Bouncing Ball
Students use the scientific method to conduct an experiment to test how a ball bounces. In this inquiry-based physical science and scientific method lesson, students drop a ball from specified heights and record the rebound, then record...
Curated OER
Where Do I Fit on the Graph?
Students collect data and create graphs about themselves, their community, and the world around them. They use a variety of methods to organize data, such as stickers, clothespins, name tags, coloring, tally marks, etc.
Curated OER
What Does Average Look Like?
Fifth graders explore the concepts of range, median, mode, and mean through the use of graphs drawn from models. They use manipulatives to represent data they have collected within their groups, and compare the differences between mode,...
Curated OER
Temperature High and Lows
Learners gather high and low temperature readings through email. For this temperature graphing lesson, students use a spreadsheet to input data for a graph. learners interpret the graphs to compare and contrast the data from different...
Curated OER
The Tipping Point
Students rewrite word problems and solve using math. In this word problem instructional activity, students gather data and observe the data. They relate this process to the scientific method and math. They review their data to be able to...
Curated OER
Bar Graphs
Young scholars perform operations and graph their data using charts and bar graphs. In this algebra lesson, students follow specific steps to make a bar graph. They create a survey about people favorite things and plot their data from...
Curated OER
Graphs
Students explore graphs and define the different ways they are used to display data. In this algebra lesson, students collect data and plot their data using the correct graph. They draw conclusions from their graphs based on their data.
Curated OER
Endocrine Disruptors in Our Drinking Water: Should We Be Concerned?
Young scholars investigate the different hormone contaminants in the water supply. In this math lesson, students analyze data tables and graphs. They demonstrate exponential growth and decay using frog populations.
Curated OER
Pick's Theorem
Students investigate polygons and their lattice. In this calculus lesson, students record data using different methods. They analyze their data and draw conclusions based on the relationship between the area and the interior lattice.
Curated OER
Predicting the Future
Students examine how scientists predict the effects of global climate change. In this environmental science lesson plan, students participate in a discussion about using computer generated data to create climate predictions. Students...
Curated OER
Opinions, Please!
Students discuss the meaning and purposes of polls and surveys. After reading an article, they analyze the results of a poll given to residents of New York City. They create a survey of their own and analyze the data to write a written...
Curated OER
Trajectory Perplexity
Students investigate measuring angles correctly through projectiles. For this geometry lesson, students launch a projectile to investigate the importance of how to measure an angle correctly and to explore trajectory. They collect data...
Curated OER
Measuring Wind Speed
Young scholars study wind speed and collect wind speed data. In this wind speed lesson, students visit a website to learn about the local wind speed forecast for their week. Young scholars discuss wind and wind speed. Students collect...
Curated OER
Critter Encounter Chart
Students record data found at an assigned web site. In this data collection lesson, students access an assigned web site in order to complete a data chart about animals they see. They travel to different sections of the web site to find...
Curated OER
Research Question, Hypothesis and Experimental Design
Learners discuss steps of the scientific process, as well as, observe a picture of the beach that they will visit. Students create a testable hypothesis about marine debris at the beach. In this science lesson plan, learners create a...
Curated OER
The Nature and Science of Technology
Fifth graders practice using the scientific method by observing and creating mold. In this bacteria lesson, 5th graders experiment creating their own mold and fungus using petri dishes and oatmeal. Students create an information table...
Curated OER
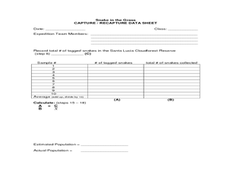
Snake in the Grass: Capture/Recapture Activity
Learners estimate the total number of species in Ecuador using the capture/recapture method. They collect data about each species and act as members of a science expedition to determine the total number of species by using mathematical...
Statistics Education Web
Sampling in Archaeology
Compare different random sampling types using an archaeological setting. Scholars collect data from an archaeological plot using simple random samples, stratified random samples, systematic random samples, and cluster random samples....
Stats Monkey
Everything I Ever Needed to Learn about AP Statistics I Learned from a Bag of M and M's®
Candy is always a good motivator! Use this collection of M&M's® experiments to introduce statistics topics, including mean, standard deviation, nonlinear transformation, and many more. The use of a hands-on model with these AP...
Curated OER
Probability and Expected Value
Students collect data and analyze it. In this statistics lesson, students make predictions using different outcomes of trials.


