Curated OER
Stem-and- Leaf Plots
Students are introduce to the notion of stem-and-leaf plots. They use stem-and-leaf plots to calculate the mean, median, and mode of a set of data. Students use computers to learn about stem-and-leaf plots.
Curated OER
Virtual Field Trip: Lodging and Meals
Students calculate the costs for lodging and meals for a virtual field trip. They calculate the number of nights lodging needed for road and city travel and the number of meals needed, the costs for each, and input the data using...
Curated OER
Word Problems
Students solve word problems using mathematical symbols. In this algebra lesson plan, students collect data and analyze it. They analyze the data using a table or graph after plotting the data.
Curated OER
How Do They Relate? Linear Relationship
Students collect information and use a line to represent it. In this algebra lesson, students investigate real world data to see if it makes a line. They graph the line comparing the relationship of the x axis with that of the y axis.
Curated OER
Census Sensibility
Students examine the importance of the census and census data collection methods. They gather statistical data, create graphs comparing state and national populations, and compose written reflections on why the census is necessary.
Curated OER
Mr. Cobbler's Shoe Dilemma
Students employ statistics to solve real-world problems. They collect, organize and describe data. They make inferences based on data analysis. They construct, read, and interpret tables, charts and graphs.
Curated OER
I'm a Weather Watcher Watching plants grow by......my,my,my
Students investigate how weather affects how plants grow. They collect data on weather and plant growth for a week and display the data on a graph. For a culminating experience they design a movie using software that shows plant growth...
Curated OER
Climate change in Canada
Students investigate the impact of human activity on the environment. In this secondary math/science lesson, students analyze and interpret information from data and graphs as they investigate trends in climate change and the reasons...
Curated OER
Finding a Line of Best Fit
Pupils engage in the practice of creating a scatter plot with the data obtained from measuring different resting heart rates. The data is used to create the table that is translated into a graph. The lesson gives instructions for the use...
Curated OER
Acid Rain Simulation
Students collect data on causes of Acid Rain. In this science lesson, students simulate the effects that produce acid rain, collect and analyze data from their samples. They relate science and statistics in this lesson.
Curated OER
Hover Above the Earth
Fourth graders build a balloon hovercraft, take direct measurements, answer critical questions, and make calculations using the data gathered in order to see the concept of acceleration as a change in velocity. They use a worksheet...
Curated OER
Direct, Inverse and Joint Variation
Eleventh graders identify, create and solve word problems involving inverse variation. In this algebra lesson, 11th graders solve problems using direct, inverse and joint variation. They identify problems using these methods.
Visa
Money Responsibility
Introduce young learners to the important life skill of responsibly managing money and recording how much they spend and save.
Curated OER
Wildlife Sampling
Seventh graders discuss water issues and its affect on salmon population. They recreate a sampling river with fish (cheddar) and scoop them to tag them (which means they exchange them for pretzel fish.) They complete a spreadsheet to...
Curated OER
Tree I.D.
Students explore various tree species. In this tree species instructional activity, students collect leaves on nature walks and use Internet sources to identify the trees that the leaves belong to. Students graph their data as well.
Curated OER
Proportionality in Tables, Graphs, and Equations
Students create different methods to analyze their data. In this algebra lesson, students differentiate between proportion and non-proportional graph. They use the TI-Navigator to create the graphs and move them around to make their...
Curated OER
Absolute Maximum and Minimum
Students calculate the maximum and minimum of each function. In this algebra lesson, students collect and graph data to analyze it. They differentiate between the absolute max and min and the maxima and minima of each function.
Curated OER
Graph and Compare the Adventure's Temperature Vs. Local Temperature
Students explore the concept graphing data. In this graphing data lesson, students use weather data from their local weather and some other city and graph them. Students plot the local weather vs. another city. Students record...
Curated OER
pH Testing
Students explore the use of variables in the scientific method. They identify the dependent and independent variables through pH testing. Students construct graphs of their data and analyze their findings.
Curated OER
The Tale of the Feral - Care and Multiplication of Feral Cats
Students differentiate between a feral cat and a domesticated cat. In this cat lesson plan, students use the scientific method, calculate averages, solve story problems, and learn how a caretaker can help a feral colony live safely.
Curated OER
Acceleration Lab
Young Einsteins experiment with the acceleration of Hot Wheels™ toy cars down inclined planes at various angles. This classic physics lab activity is thoroughly explained in both a teacher’s guide and a student lab sheet. Science...
Curated OER
Which Pizza
Seventh graders investigate the data related to finding the favorite type of pizza that 7th graders eat. The data is analyzed taken from a survey that focuses on the toppings of the pizza and not the brand. Students practice the sampling...
Curated OER
Square Foot Garden
Students plant a garden and keep track of it. In this geometrical garden lesson plan, students collect data from their garden twice a week. They graph their finding and figure out how many square feet of growing space each person needs...
Curated OER
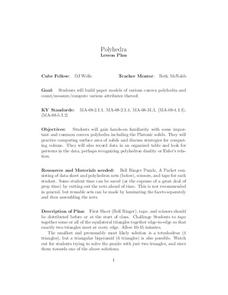
Polyhedra
Students analyze convex polyhedra through hands on methods. In this geometrical shapes lesson plan, students construct paper models of convex polyhedra and identify the different properties including the number of sides, faces and edges.


