Curated OER
Twisters
Students differentiate between the terms 'tornado watch' and 'tornado warning' and simulate the conditions that produce tornadoes. They read "Night of the Twisters" by Ivy Ruckman and conduct an experiment using two-liter plastic...
Curated OER
Cloud Shadows
Students classify clouds as transparent, translucent or opaque. They conduct an experiment to determine the visual opacity of several classroom objects and then conduct further observations of clouds.
Illustrative Mathematics
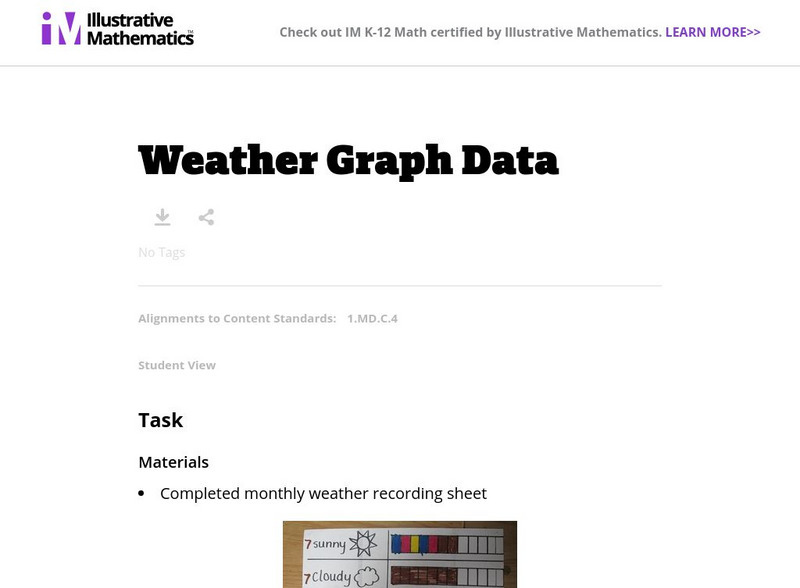
Illustrative Mathematics: Weather Graph Data
The purpose of this task is for students to represent and interpret weather data, as well as answer questions about the data they have recorded. Student worksheets and recording sheet are included.
University Corporation for Atmospheric Research
Ucar: Project Sky Math
Teachers will be interested to explore the SkyMath module, and the 16 classroom activities at this site. In this program, students will collect and record real-time weather data to analyze. Data analysis, graphing, number relationship,...
University of Illinois
University of Illinois: Earthquakes of the World
Resource contains a lesson plan that utilizes data from earthquakes. Students are instructed to analyze and interpret line graphs that display the earthquake data.


