Curated OER
Problem-Solving Application: Use a Graph
In this problem solving worksheet, 6th graders use the problem solving steps of understand, plan, solve and look back to answer a graphing question.
Curated OER
Circle Graphs
Sixth graders interpret, create, and display data in a circle graph. In this circle graph lesson plan, 6th graders use a compass, protractors, pizza boxes, and more to create a circle graph and analyze the data they put into it.
Curated OER
6-8 Baseball Fun: Percentages, Decimals, and Fractions
Students practice the concepts behind fractions, decimals, and percents by using sports statistics on baseball cards. In this baseball math lesson, students use fractions and estimation to calculate statistics. Students calculate batting...
Curated OER
Dealing With Data
Young scholars collect, organize, and display data using a bar graph, line graph, pie graph, or picture graph. They write a summary describing the data represented and compare the graph to another graph in the class.
Curated OER
Information at a Glance - Using Tables in Mathematics
Learners create table to display GED Testing data located in paragraph provided by teacher, use information in table to create appropriate graph, and determine percentage difference between passing scores and failing scores.
Curated OER
Great Tasting Shapes
Fifth graders investigate the concept of median, mode, and range using a simple model for display purposes. They examine different shaped crackers out of a box and identify the ones that occur the most. Then the calculations for the...
Curated OER
Geo-Critters (Geometry Critters)
Learners read the book The Math Curse by Jon Scieszka and study geometry. For this geometry lesson, students identify geometric shapes and their properties. Learners create a geo-critter.
Alabama Learning Exchange
What's Your Favorite Chocolate Bar?
Students complete a math survey. For this math graphs lesson, students complete a survey about their favorite candy bars. Students create different kinds of graphs using Microsoft Excel to show their results.
Curated OER
Graphing Fun In Third Grade
Third graders display information in a graph, table, and chart. In this data lesson plan, 3rd graders look at graphs, tables, and charts, discuss their importance, and make their own.
Curated OER
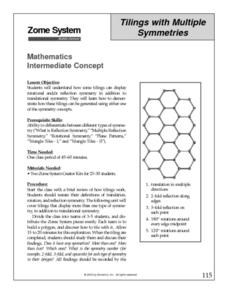
Tilings with Multiple Symmetries
Pupils explore how some tilings can display rotational and/or reflection symmetry in addition to translational symmetry. Students demonstrate how these tilings can be generated using either one of the symmetry concepts and Zome System...
Curated OER
Safety at Home
First graders identify safety hazards in the home and learn ways to prevent home accidents. In this home safety lesson, 1st graders discuss ways to keep a home safe by brainstorming and then reading a story about home safety. They make...
Curated OER
Tally Time
Students create a tally chart. For this math and health lesson, students discuss healthy foods and create a tally chart showing the number of students who like to eat healthy foods.
Curated OER
Plastic Packaging
Students collect data. In this math lesson, students collect data about recyclable materials. Students develop a plan that will help the environment. Recycling plastic containers is discussed.
Curated OER
Happy Birthday Mathematicians and Me
Middle schoolers choose a mathematician or scientist born on the same day as the student and research them. They create a cube or tetrahedron and place required information on the sides (such as birth year, death yr., greatest...
Curated OER
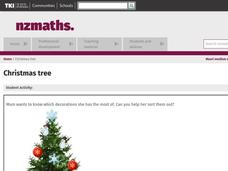
Christmas Tree
Ask the students for ideas on sorting the decorations so that they could tell someone what was in the box. Students share idea for sorting a box of Christmas decorations so that they could tell someone what was in the box. They share...
Curated OER
Favorite Foods at Thanksgiving
Fourth graders study different types of graphs as a means of displaying information. They survey others to find their favorite Thanksgiving food and then graph the results using different types of graphs.
Curated OER
Mystery Graphs
Students study graphs and learn how to display information into a graph. For this graph lesson plan, students construct a graph of their own sorted data, and pick out things in graphs that are inconsistent.
Curated OER
Computation with Real and Complex Numbers
In this computation with real and complex numbers worksheet, students use addition, subtraction, multiplication and division to solve 26 problems with complex numbers to win a bingo game.
Curated OER
A Thanksgiving Survey
Students conduct a survey. In this math lesson, students design and conduct a survey about Thanksgiving foods. Students display the collected data in a graph and use the graph to determine what food to serve for a Thanksgiving meal.
Curated OER
Analyzing Graphs and Data
Students collect and analyze data. In this statistics lesson, students graph their data and make inferences from the collected data. They display their data using graphs, bar graphs, circles graphs and Venn diagrams.
Curated OER
Millions, Billions, Trillions
Students use real-world data to compare the relative sizes of millions and billions, and exponential growth. They use the salaries of famous people such as, Michael Jordan and Bill Gates to understand this math concept.
Curated OER
It All Adds Up
Students brainstorm reasons for politicians to expand recycling programs and find statistics to support recycling programs. They design posters, displaying a compelling statistic about recycling, to convince students at their school to...
Curated OER
Adding Pennies, Nickels and Dimes
Students add pennies, nickels and dimes and organize the coins to display a variety of price values from real life examples. They discuss the importance of money in the day-to-day world.
Curated OER
It's a Ball, It's a Sphere ... No, It's a Dodecahedron
Third graders construct a dodecahedron that displays facts about two and three-dimensional figures. They use a pattern to construct a dodecahedron after writing facts about geometry onto each of the figure's twelve faces.


