Curated OER
Explore Three-Dimensional Shapes
Students are assigned to shape groups and explore three-dimensional shapes. They review math skills and two-dimensional shapes.
Curated OER
Play Dough Pizza Party
Students review fractions using a visual display. They receive a can of Play Dough and have to complete a worksheet figuring out how to divide up a pizza for a specified number of guests.
Curated OER
Ants in Your Pants
First graders read "One Hundred Angry Ants" by Elinor Pinczes. They identify various sums that equal ten and display them on a chart.
Curated OER
Graphing Valentine Candies
Fifth graders organize and display information in bar graph form using appropriate labels. Each student receives a box of Valentine heart candies, a worksheet of the tally chart and a worksheet of the bar graph.
Curated OER
GPS Art
Students design their own logo or picture and use a handheld GPS receiver to map it out. They write out a word or graphic on a field or playground, walk the path, and log GPS data. The results display their "art" on their GPS receiver...
Curated OER
Pie Charts
The teacher conducts a survey of each student's favorite color. The teacher then creates a pie chart identifying the information gathered. The students display mastery by creating their own pie chart displaying the same information.
Alabama Learning Exchange
Meteor or Meteorite
Students differentiate between a meteor and meteorite. They participate in an experiment to discover how the size and weight of an object determines the size of the impact crater. They utilize their math skills by measuring with a ruler...
Curated OER
Our Favorites
Learners participate in and conduct a survey to determine various class favorites. They collect, organize and display their data, interpret the results, and complete a packet of worksheets to display the information.
Curated OER
The Expanding United States
Middle schoolers display comprehension of the concept of nationalism. They design a tool to conduct a survey. Students conduct a survey to find out which groups middle schoolers feel affiliated (family, nation, religion, school, etc). ...
Curated OER
Designing the Perfect Science Fair Project Webquest
Sixth graders examine the Scientific Method and define their topic of interest. Students familiarize themselves with how to utilize their resources and create note cards. Students create their written report and display of their...
Curated OER
Shopping Spree
Students calculate discounts, sale price, and sale tax. In this consumer math lesson plan, students visit mock stores which have items for sale. Students calculate the final prices of items.
Curated OER
Bagel Algebra
Ninth graders apply proportional reasoning to a real-life situation. In this Algebra I lesson, 9th graders explore a series of equations that relate to a display sign that compares the owner’s bagels to competitors bagels. ...
Curated OER
Jumping to Conclusions
Students decide as a class what their data is going to be to graph. In this math lesson, students organize data so that it will be easier to display in a graph. Students are guided through the process by their teachers, and helped with...
Curated OER
Student Heights
Students measure the heights of their fellow classmates and create a box and whisker plot to display the data. In this measurement lesson plan, students analyze the data and record results.
Curated OER
What Are We Listening To?
Learners gather data from a web site on number of music albums sold by genre for the last two years. They convert these figures to fractions, decimals, and percents, and display the results in bar graphs and pie charts.
Curated OER
Wax Resist Fish
Students review what a pattern is and they create a pattern on a fish. They are reminded that patterns do not change halfway through and they paint over it with watercolor paints. They display their fish on the walls.
Curated OER
100s of Ants
First graders count to 100 orally as they use grids to display the 100 raisins they counted.
Curated OER
Places, Places, Everyone
First graders play the game Show Me and use math software to practice place value.
Curated OER
Smoking: The Real Cost
Third graders discuss the adverse effects of smoking and predict the financial cost of a smoking habit. They collect data regarding the cost of a pack of cigarettes and average packs smoked a day. They create bar graphs displaying the...
Curated OER
Christmas Presents
Seventh graders create a graph of their Christmas gifts. They develop categories, compute fractional and decimal parts for each category, identify the number of degrees to represent each fractional part, and create a circle graph to...
Curated OER
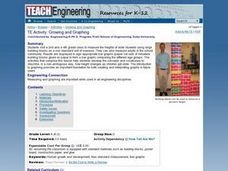
Growing and Graphing
Students visit a 2nd and a 4th grade class to measure the heights of older students using large building blocks as a non-standard unit of measure. They can also measure adults in the school community. Results are displayed in...
Curated OER
I'm a Weather Watcher Watching plants grow by......my,my,my
Students investigate how weather affects how plants grow. They collect data on weather and plant growth for a week and display the data on a graph. For a culminating experience they design a movie using software that shows plant growth...
Curated OER
Coin-a-copia: A Thanksgiving Glyph Activity
Students explore glyphs that are pictorial representations of data. Students collect and display data about themselves and a variety of other topics. Students practice using a legend to analyze and interpret data.
Curated OER
Related Number Pairs
Third graders use tables to organize and display related pairs of numbers, such as the relationship of the number of insects to the total number of legs. They generate a table of related number pairs based on a real-life situation,...


