Curated OER
M&M’s Math Worksheet
Who knew you could cover prediction, histograms, fractions, decimals, data collection, and averages (mean, median, and mode) all with a bag of M&M's®? Here's a fantastic set of worksheets to help you make candy a mathematical journey...
Curated OER
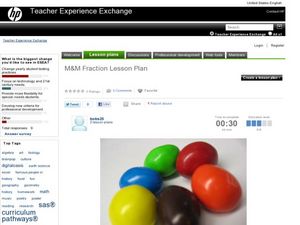
Teaching fractions & ratios with M&Ms
Students collect data using M&Ms, fill in charts, and write ratios and fractions for each color M&M.
Curated OER
M&Ms; Line Plots and Graphing
Students, using small individual bags of M&Ms, engage in activities including; estimating, sorting, graphing, mean, median, mode, fractions, percentage, and averaging.
Curated OER
Fractions
Fourth graders explore fractions. They use Skittles and M&M's to practice adding and subtracting fractions. Students review the numerator and the denominator of fractions. They count the number of each color of Skittles and M&M's...
Curated OER
M&M's
Students use M&M candies to show fractions, percents, and ratios. Individually, they complete a worksheet using their candies and solving equations of greater than or less than. They review their answers and strategies used as a...
Curated OER
Investigation - The M & M Mystery
Sixth graders inspect M&M's to complete statistical data. Students interpret percent of colors represented. They convert data from decimals, fractions, and percents. Using the data, 6th graders create a bar graph and a circle graph.
Curated OER
M&M Ratios
Third graders explore ratios. In this probability instructional activity, 3rd graders sort and count M&M's and identify the ratios of different colors. Students use the attached worksheet as an assessment.
Curated OER
Graph Lab
Seventh graders explore bar graphs and pie charts. Given a pack of M&Ms, 7th graders explore the colors, sort the data in a frequency chart and then construct bar graphs and pie charts to categorize the M&Ms by color. Students...
Curated OER
Environmental Graphing
Learners experiment with graphing. In this graphing introduction lesson plan, students complete four activities: 1) a bar graph based on class birthdays 2) an estimation graph of the raisins in raisin bread 3) another estimation example...
Curated OER
A Recipe for Air
Students create a pie graph using M&Ms to demonstrate the composition of air. They label each section of the graph, and list the fractions from largest to smallest.


