Curated OER
Quiz: Central Tendency and Dispersion
In this central tendency and dispersion worksheet, students find the mean, median and mode of a set of numbers. The set of numbers is not included on this worksheet. They complete a frequency distribution and find the modal interval.
Statistics Education Web
Saga of Survival (Using Data about Donner Party to Illustrate Descriptive Statistics)
What did gender have to do with the survival rates of the Donner Party? Using comparative box plots, classes compare the ages of the survivors and nonsurvivors. Using the same method, individuals make conclusions about the...
College Board
2006 AP® Statistics Free-Response Questions Form B
Test a significant review of statistical questions. The resource provides pupils and teachers with insight into the way the exam assesses statistical concepts. Half of the released questions from the 2006 AP® Statistics Form B...
Curated OER
Are Taxes "Normal?"
Students explore the concept of normal distribution. In this normal distribution lesson, students find the normal distribution of taxes in the 50 US states. Students make histograms, frequency tables, and find the mean and median of tax...
Curated OER
Pi Digit Distribution
Students study graphing skills and compare and contrast data sets. They compute pi through the first 50-100 digits and create a bar graph showing the frequencies of specific digits.
Inside Mathematics
Archery
Put the better archer in a box. The performance task has pupils compare the performance of two archers using box-and-whisker plots. The resource includes sample responses that are useful in comparing individuals' work to others.
Curated OER
The Histogram
In this Algebra I/Algebra II worksheet, students construct and analyze histograms to develop a visual impression of the distributions of data. The two page worksheet contains five problems. Answer key is provided.
Curated OER
PDF's and PMF's
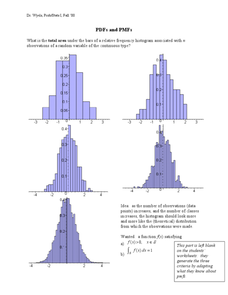
In this probability worksheet, learners solve for the area under the frequency histograms. They identify the area using the derivative. There are 3 questions.
Curated OER
A Picture's Worth a Thousand Words
High schoolers analyze the numbers of male vs female administrators and teachers from their school. In this gender equality lesson plan, students use school yearbooks from the 1950's threw present to count how many male vs. female...
Texas Instruments
Classifying Functions
Learners explore linear, quadratic, and exponential functions in this activity that makes use of TI Navigator and TI Plus calculators. Using the technology, learners compare and contrast the three types of functions given in...
Curated OER
A Pocketful of Change
Students study the meaning, symbolism, and value of U.S. coins,
especially the quarter. They conduct a survey of coins in students'
possession, graphing the results to show frequency distribution and drawing
inferences about the U.S....
Virginia Department of Education
May I Have Fries with That?
Not all pie graphs are about pies. The class conducts a survey on favorite fast food categories in a lesson on data representation. Pupils use the results to create a circle graph.
Curated OER
Integrated Algebra Practice: Histograms
In this histogram worksheet, students solve 6 multiple choice and short answer problems. Students read histograms and determine the frequency of a particular item.
Curated OER
Volume, Mass, and Weight
Study the difference between mass and weight. Your math group will compare the weight of an item to the amount of space that it uses. They'll then use conversion factors to find the difference between kilograms and pounds. Essential...
Curated OER
Statistics
High schoolers log their computer usage hours. They determine the mean, median, mode and standard deviation of the collected data. They make a frequency histogram of the grouped data, both on graph paper, and on the TI 83+ graphing...
Curated OER
How to Make Histograms
Young scholars collect data and plot it using a histogram. In this statistics instructional activity, students interpret histograms. They find the frequency, percents and density.
Curated OER
Matrices and Vectors
In this matrices and vectors worksheet, students solve 9 various types of problems related to forming matrices and vectors. First, they set up each system of equations listed in matrix form using mathematical notation. Then, students...
Curated OER
Graphing Trigonometric Functions
The student should be able to transfer his knowledge of graphing functions to graphing trigonometric functions. Student should be able to graph trigonometric functions, find amplitude, period, and frequency.
Curated OER
Measure of Spread
Students identify the standard deviation. In this statistics instructional activity, students find the mean distribution and calculate the percent of deviation from the mean. They observe this change on the Ti calculator.
Curated OER
Multiply Boxplots
Students identify the mean, quartiles and range of a boxplot. In this statistics lesson, students identify cooperative boxplot as it relates to the data. They make conjectures about students grade distribution.
Curated OER
Fair Games
Fifth graders examine the statistics of playing games. Many games of chance and activities in maths text books involve rolling two dice and combining the scores, usually by addition. Students often find the probabilities of such events...
Curated OER
Super Bowl Champs
In this Super Bowl worksheet, students create line plots of all winners and losers of the Super Bowl. They create stem-and-leaf plots, scatter plots, and bar graphs of football data. This one-page worksheet contains...
Curated OER
Measuring Volume/Capacity Using the Metric System
There is more than one way to measure an amount, as learners discover by applying multiple measurement tools in these activities. Centimeter cubes, cylinders, beakers, and measuring cups are used to find the volume of regular and...
Curated OER
Describing Data
Your learners will practice many ways of describing data using coordinate algebra in this unit written to address many Common Core State Standards. Simple examples of different ways to organize data are shared and then practice problems...


