Balanced Assessment
Writing and Sketching Resource
Picture this—the class creates pictures using functions. Here, learners build functions to model specific graphic criteria. They use their knowledge of parent functions and transformations to create the perfect function.
Balanced Assessment
Garages and Phones
Examine and compare a linear and step function. The task provides two scenarios, one modeled by a linear function and the other a step function. Pupils create a graph for each and explain how each compares to the other.
Point Pleasant Beach School District
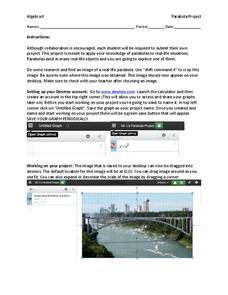
Parabola Project
Class members select a picture that contains a parabola and construct a drawing of it using function graphs in the quadratic project. Individuals restrict the domains of the functions to create a more accurate drawing. They then submit a...
Kenan Fellows
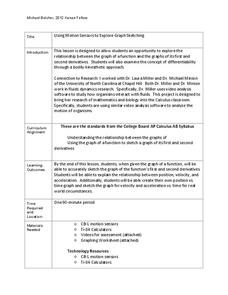
Using Motion Sensors to Explore Graph Sketching
Get moving to a better understanding of graphs of derivatives. Using motion sensors, scholars vary their velocities to create graphs of the first derivative of a function. The activity challenges groups to first create a script of the...
Concord Consortium
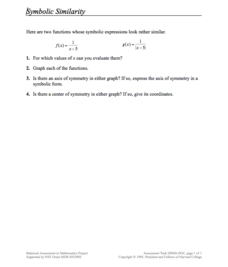
Symbolic Similarity
How many things does one transformation tell you? Learners compare and contrast the graphs of different parent functions with the same transformation. Using a rational and absolute value function, pupils identify key features of their...
Curated OER
Yam in the Oven
Your vegetable eaters will practice function notation statement interpretation in this short task. These few exercises will bring out misconceptions students may have about function notation as well.
Balanced Assessment
Melons and Melon Juice
Model the difference between the graphs of discrete and continuous functions. Scholars examine two scenarios and construct graphs to model the situation. They then compare their graphs that illustrate the subtle difference between these...
02 x 02 Worksheets
Inverse Variation
Discover an inverse variation pattern. A simple lesson plan design allows learners to explore a nonlinear pattern. Scholars analyze a distance, speed, and time relationship through tables and graphs. Eventually, they write an equation to...
CK-12 Foundation
Even and Odd Functions and Function Symmetry: Even and Odd Functions (Symmetry)
Even money states that the resource is good to use. Scholars manipulate an interactive to adjust the portion of a graph to the left of the y-axis. The interactive allows them to switch between even and odd modes that show the right side...
Concord Consortium
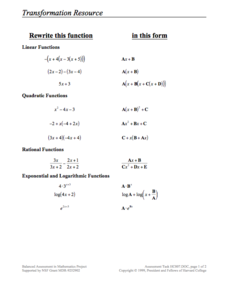
Transformations Resource
Transform your lesson for transforming functions. Scholars transform linear, quadratic, exponential, rational, and trigonometric expressions. They write their expressions to fit specific forms and identify the values of the resulting...
Concord Consortium
Writing and Sketching II
Find the function that fits. Scholars first identify the graph of a function that looks the same after a horizontal translation. They must then find the equation of a function whose graph lies only in two adjacent quadrants.
Mathematics Vision Project
Module 7: Connecting Algebra and Geometry
The coordinate plane links key geometry and algebra concepts in this approachable but rigorous unit. The class starts by developing the distance formula from the Pythagorean Theorem, then moves to applications of slope. Activities...
West Contra Costa Unified School District
Using Derivatives to Graph Polynomials
You can learn to graph as well as a calculator using calculus. The lesson introduces using derivatives to find critical points needed to graph polynomials. Pupils learn to find local maximums and minimums and intervals of increase and...
Illustrative Mathematics
Latitude
The greater the latitude, the less of the Earth is north. Scholars graph the relationship between the latitude and the percentage of the Earth that is north of the latitude. Using the graph and the table, class members interpret values...
Illustrative Mathematics
Carbon 14 Dating in Practice I
How old is the plant? Here is a task that presents the exponential decay function for carbon 14 in a plant. Pupils use the function to estimate the amount of carbon 14 in the plant when it died and analyze the function to find what the...
Shodor Education Foundation
Graph Sketcher
Sketch graphs with the Graph Sketcher. Scholars graph functions on a coordinate plane. An interactive makes it as easy as inputting the function and clicking a button.
CK-12 Foundation
Finding and Defining Parts of a Polynomial Function Graph
So many things to remember when graphing polynomials and this guide gives a helping hand to do so. The packet goes through examples and explains things like critical values, end behavior, and multiplicities. There are image links and...
Teach Engineering
Cell Membrane Structure and Function
Teach your class how to get out of a cell — or break in. The third installment in a seven-part series introduces the class to cell membranes and their functions. The lesson plan includes information to present to the class,...
Shodor Education Foundation
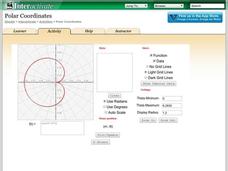
Polar Coordinates
Polar opposites might not work together—but polar coordinates do! The interactive provides learners the opportunity to graph trigonometric and algebraic functions using polar coordinates. The program takes either individual data points...
CCSS Math Activities
Ferris Wheel
Wheel the resource right into your classroom. Young mathematicians use given dimensions of a Ferris wheel to write a height versus time function. They use their functions to answer a set of questions about the Ferris wheel.
Mathematics Vision Project
Module 7: Structure of Expressions
The structure of an expression is a descriptive feature. Learners build a solid understanding of quadratic functions using an analysis of expressions in different forms. The seventh module in a series of nine includes 12 lessons...
Flipped Math
Calculus AB/BC - Interpreting the Behavior of Accumulation Functions Involving Area
Accumulation functions should behave like other functions. Using content from Unit 5, pupils analyze the first and second derivative to determine the behavior of an accumulation function. Learners find out how to calculate the relative...
National Council of Teachers of Mathematics
National Debt and Wars
Take a functional approach to the national debt. Learners collect information about the national debt by decade and plot the data. They determine whether an exponential curve is a good fit for the data by comparing the percent changes...
Benjamin Franklin High School
Saxon Math: Algebra 2 (Section 4)
This fourth of twelve units in a series continues the investigation of functions through equations and inequalities. However, the modular nature of the lessons in the section make this an excellent resource for any curriculum covering...
Other popular searches
- Math Functions Quadratic
- Math Functions Domain Range
- In/out Math Functions
- Math Functions and Patterns
- Math Functions Egg Carton
- Math Functions Spaghetti
- Math Functions Bridge
- Math Functions Rounding
- Composite of Math Functions
- Math Functions Quadractic
- Functions Math
- Linear Functions Math Models


