EngageNY
Modeling from a Sequence
Building upon previous knowledge of sequences, collaborative pairs analyze sequences to determine the type and to make predictions of future terms. The exercises build through arithmetic and geometric sequences before introducing...
Annenberg Foundation
Skeeters Are Overrunning the World
Skeeters are used to model linear and exponential population growth in a wonderfully organized lesson plan including teachers' and students' notes, an assignment, graphs, tables, and equations. Filled with constant deep-reaching...
Curated OER
Chairs Around the Table
Youngsters become flexible problem solvers with this challenging lesson. If there are 24 square tables in a restaurant, how many customers can be seated at one time? They can use manipulatives or draw pictures to help them find the...
Curated OER
Does Your Field Measure Up
Students measure angles using a plane table kit. In this geometry lesson, students use trigonometric identities to find the values of the length of a football field.
University of Georgia
Using Freezing-Point Depression to Find Molecular Weight
Explore the mathematical relationship between a solvent and solute. Learners use technology to measure the cooling patterns of a solvent with varying concentrations of solute. Through an analysis of the data, pupils realize that the rate...
EngageNY
Logarithms—How Many Digits Do You Need?
Forget your ID number? Your pupils learn to use logarithms to determine the number of digits or characters necessary to create individual ID numbers for all members of a group.
EngageNY
Completing the Square (part 1)
Avoid the trap of memorizing steps when completing the square with a resources that provides a conceptual approach to completing the square. Learners that are able to recognize a perfect square trinomial are ready to complete the square.
Curated OER
Count on Me
Fourth graders use inductive reasoning to find algebraic patterns in geometric figures. They use technology (i.e., calculators, computers) and manipulatives to discover number patterns involving geometric concepts. They solve concrete...
Curated OER
How Alike Are We?
Fourth graders find the range, mode, median, and mean for each of the data sets (height and shoe size). They discuss which measure of central tendency for each data set best represents the class and why. Students graph the shoe size and...
Shodor Education Foundation
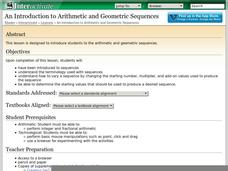
An Introduction to Arithmetic and Geometric Sequences
Help your class look for patterns as they create their own arithmetic and geometric sequences. Engage learners with an introductory discussion on sequences and use the applet to let them explore how sequences are formed. Teachers might...
Curated OER
Investigation - Looking For Triangles
Seventh graders investigate a series of triangles, looking for patterns and generalizing what they have found. They analyze the pattern data and organize it into a table and graph. Students identify the relationship and discover the rule...
Curated OER
Scattered About
Students are introduced to the concept of scatter plots after reviewing the various types of graphs. In groups, they analyze the type of information one can receive from a scatter plot and identify the relationship between the x and y...
Curated OER
Rainbows, Bridges & Weather, Oh My!
Explore how real-world applications can be parabolic in nature and how to find quadratic functions that best fit data. A number of different examples of modeling parabolas are explored including a student scavenger hunt, the exploration...
Curated OER
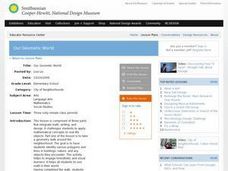
Our Geometic World
Pupils walk around the neighborhood and identify various polygons and lines in buildings, nature and other objects. They design a building using various geometric patterns, shapes and lines. Students complete a descriptive writing of...
Curated OER
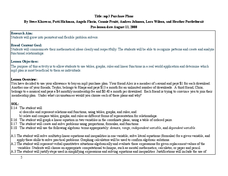
MP3 Purchase Plans
Use algebra to solve real world problems. Mathematicians practice use of graphs, tables, and linear functions to solve a problem regarding mp3 purchase plans. They work in groups to solve the problem and present their findings and...
Curated OER
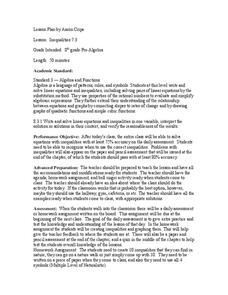
Inequalities 7.3
Graph inequalities and discuss the difference in their slopes. Learners observe rate of change as they compare linear, quadratic, and cubic functions.
Curated OER
Adding and Subtracting Algebraic Expressions (Combining Like Terms)
Everyone loves math when it includes food! This lesson tries to take the notion of combining like terms in algebra and comparing it to sorting apples and oranges. It takes a step-by-step approach to helping students understand this...
Curated OER
Worksheet 33 - Sequence
In this sequence worksheet, students find the limits of given sequences and prove theorems. This one-page worksheet contains four multi-step problems.
Curated OER
Relationships and Functions
Fifth graders describe patterns as relations and functions. In this patterning instructional activity, 5th graders analyze and continue patterns. Students understand how patterns relate to relations and functions.
Curated OER
Optimization For Breakfast
Students identify he proportion of a cereal box. In this algebra lesson, students define the relationship between patterns, functions and relations. They model their understanding using the cereal box.
Curated OER
Graphing Real World Situations
High schoolers solve linear equations using graphs. In this algebra lesson, students depict real life situation using lines and functions. They identify the slope, data and predict graphing behavior.
Curated OER
Thirst Dilemma (Drinking in the Desert)
Ninth graders explore linear functions. In this Algebra I lesson, 9th graders collect and analyze date as they investigate the question of how long will water last if you are trapped in a desert. Students create scatterplots of their...
EngageNY
The Definition of Sine, Cosine, and Tangent
Introduce your classes to a new world of mathematics. Pupils learn to call trigonometric ratios by their given names: sine, cosine, and tangent. They find ratios and use known ratios to discover missing sides of similar triangles.
Curated OER
Linear Regression and Correlation
Learners explore scatter plots. In this linear regression lesson, groups of pupils graph scatter plots and then find the line of best fit. They identify outliers and explain the correlation. Each group summarizes and shares their...


