American Statistical Association
Scatter It! (Using Census Results to Help Predict Melissa’s Height)
Pupils use the provided census data to guess the future height of a child. They organize and plot the data, solve for the line of best fit, and determine the likely height and range for a specific age.
American Statistical Association
How Random Is the iPod’s Shuffle?
Shuffle the resource into your instructional activity repertoire. Scholars use randomly-generated iPod Shuffle playlists to develop ideas about randomness. They use a new set of playlists to confirm their ideas, and then decide whether...
Curated OER
Linear and Quadratic Model, Data Modeling
Learners model quadratic and linear equations. In this algebra lesson, students solve word problems using equations. They create scatter plots and make predictions using correlations.
Curated OER
Exploring Expressions
Examine parts of an expression in this algebra instructional activity. Ninth graders identify the properties of the coefficient and their behavior to the graph. They graph the equation on a TI to see their results.
EngageNY
Properties of Logarithms
Log the resource on logarithms for future use. Learners review and explore properties of logarithms and solve base 10 exponential equations in the 12th installment of a 35-part module. An emphasis on theoretical definitions and...
Ohio Department of Education
The Solution is Complex
Consider complex numbers, roots, and quadratic equations. Use the discriminate as a way to determine the nature of a quadratic's roots. Then discuss the similarities and differences between quadratics with two, one, or no real roots....
Curated OER
Sippin' on Smoothies
Why is calcium good for the body? Where is it stored? Young chefs discover the importance of calcium and review a list of foods that are rich in the material. They then make delicious smoothies high in calcium! Teaching kids how to make...
Google
Surveys and Estimating Large Quantities
Looking for an estimation activity a bit more involved than the typical "guess the number of jellybeans in the jar" game? Here, learners use a picture to estimate the number of people at a large event, look for potential problems with...
Visa
Making Spending Decisions
By role playing real-world experiences, such as purchasing snacks and grocery/toy store shopping, your youngsters will begin to develop an understanding of how to make decisions and choose between alternatives. This is the first lesson...
Curated OER
Ratios and Proportions
This study guide would be great to use when presenting a lesson on ratios and proportions. It includes clear definitions, explanations, and examples to work through as a class or individually. In addition, it has notes on rates and...
Curated OER
Writing Linear Equations in Different Forms
Can your class write linear equations three different ways? Here is a study guide that includes slope-intercept, standard, and point-slope forms. Learners are given the slope and a point on the line, or two points and are asked to write...
Curated OER
Solving Multi-Step Inequalities
Ready to study inequalities with your class? Use this activity to solve multi-step inequalities and graph the solutions. The document would be great to use as a study guide as you present the material, or could easily be modified and...
Curated OER
Graphing Inequalities in Two Variables
This study guide is a great resource to help you present the steps to graphing linear inequalities. Show your class two different ways to graph an inequality and work on a real-world example together. The document could also be easily...
National Security Agency
What’s Your Coordinate?
Your middle schoolers will show what they know with their bodies when they become the coordinate plane in this conceptual development unit. Starting with the characteristics of the coordinate plane, learners develop their skills by...
Curated OER
Move It
Studens collect and graph data. In this algebra lesson, students use a CBL and CBR with a TI Calcualtor to observe linear graphs. They use the correct vocabualry as they discuss the collected data.
Curated OER
Introduction to Arithmetic and Geometric Sequences
Students examine the concept of sequences. Students create a sequence using varied starting numbers, multipliers, and add on values. Students practice determining the starting values to use in order to produce a desired sequence.
Curated OER
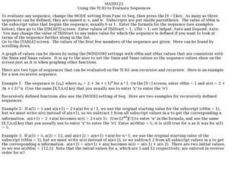
Using the TI-83 to Evaluate Sequences
In this evaluating sequences worksheet, students use the TI-83 graphing calculator to evaluate sequences. Instructions on how to use the calculator with these type of problems is provided. There are three problems on this one-page...
Curated OER
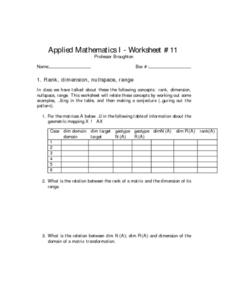
Linear Algebra
For this linear algebra worksheet, learners solve 3 different sets of problems that include rank, dimension, nullspace and range of linear algebra. They determine the relation between the rank of a matrix and the dimension of its range....
Curated OER
Calculating Total Amount of Homework Done
In this exponential growth problem, students calculate the total number of hours of homework done in a thirty-six week period if she does one second of homework the first week and doubles that every week. Students need to take into...
Curated OER
Mixed Fraction Sequences
In this math worksheet, students complete the mixed fractions that are sorted into a sequence. The sheet is intended as a teacher's guide.
Curated OER
Decimal Sequences
In this math worksheet, students solve the problems that are intended to focus upon he sequences of decimals. The sheet is a teacher's guide.
Curated OER
The Apple Orchard Problem
Students explore various approaches to solving a problem of maximizing the total production of apples in an orchard. In this apple orchard instructional activity, students collect data in order to solve the apple orchard problem...
Curated OER
Get On Board
Students create a ticket table illustrating the cost of tickets by alternative transportation. In this number sense activity, students write number sentences to compare and contrast difference information in their chart. Students figure...
Curated OER
Linear and Exponential Models
Learners linearize data to determine if an exponential model is suitable. For this linearizing data to determine if an exponential model is suitable lesson, students graph the residuals of sets of data that appear to have an exponential...


