Curated OER
Walking on Air
Students collect and analyze data with a graph. For this statistics lesson, students use central tendencies to find the meaning of their data. They display the data on a Ti calculator.
Curated OER
Fractal Fern
Students identify the location of coordinate pairs of an image. In this geometry lesson, students perform transformation and identify the image and pre-image point of location. They apply the concept of fractals to complete the...
Curated OER
Building a Rover
Middle schoolers investigate properties of lines and points by making a rover. In this algebra lesson, students plot points correctly on a coordinate plane. They identify coordinate pairs given the plots and lines.
Curated OER
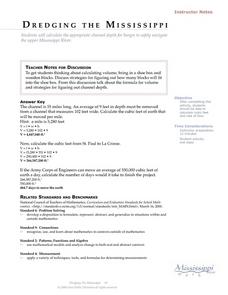
Dredging the Mississippi
Students determine the amount of earth that needs to be removed from the Mississippi and the amount of time it takes the Army Corps of Engineers to complete a dredging project. Given specific dimensions of a channel, calculations are...
Curated OER
Using Recipes to Reinforce Fractions
Students, in groups, make a presentation to the class explaining how and what they did to increase the recipe they were given so that they would have the correct amount of ingredients to make their pancakes for the whole class.
Curated OER
Save Your Change
Learners solve problems involving exponential, logarithmic, and scientific notations. Using calculators, students explore investment problems. They use a formula and logarithms to determine the years to earn a particular income, figure...
Curated OER
Design-a-Lesson-Packaging a Product
Students in a teacher education class address consumer related issues involving packaging. Using volume, surface area and graphs, they create a package for a given volume of a product. They design modifications for this lesson and to...
Curated OER
Introduction to Plates, Axles, and Gears
Students are introduced to the function and design of the following Lego pieces: beams, bricks, plates, axles, tires, hubs and bushings. They then work with a partner to build something using only these pieces.
Curated OER
Technology: Programming Graphics
Students use the DrScheme program to create graphics for clip art. Using graphics, they plan their designs using basic shapes, plotting its positions, and studying the relationships between points. By plotting the necessary data on...
Curated OER
Communities at Work
Pupils explore how people function together in small communities to reach a common goal.
Curated OER
Problem Solving in Mathematics
Seventh graders discover that there are multiple strategies to be used in problem solving. They explain a problem solving situation in their own words and determine a possible strategy for solving the problem.
Curated OER
Using Representations to Model Problems
student make predictions or draw conclusions based on physical and visual representations of profit and sales. They model problems with physical materials and visual representations, and use models, graphs and tables to draw conclusions...
Curated OER
Exploring Arrangements of 2, 3, 4, and 5 Cubes
Students construct models of various tricubes, tetracubes, and pentacubes that are possible, classify n-cubes into different groupings, and draw these figures on isometric dot paper giving true perspective to what they visualize.
Curated OER
What Time is It?
Students explore time by completing worksheets. In this time-telling lesson, students utilize images of clocks and determine what time they read. Students answer more clock questions with a Smart Board and complete a clock worksheet with...
Curated OER
Virtual Field Trip / Route, Mileage and Gasoline Cost Graphs
Students use a spreadsheet program to graph and compare milage, gasoline costs and travel time for two travel routes in their virtual field trip in Michigan. They determine the most economical route based on the graphs and calculations.
Curated OER
The Great Button Sort
Students practice figuring out how items have been sorted. They also sort buttons in small cooperative groups. They color and sort their own paper buttons and then give their button sort to another student to see if he or she can figure...
Curated OER
Virtual Field Trip
Students calculate gasoline cost per mile on a virtual field trip. They calculate the gasoline costs and travel time for each of the 2 routes, and record on a data sheet. They use Excel to create data tables for mileage, gasoline...
Curated OER
Looking For Triangles
Students solve problems with triangles. For this geometry lesson, students analyze shapes to find different triangles. They name the shapes created by putting triangles together.
Curated OER
Are You Absolutely Sure of the Value?
Seventh graders develop an examineing of absolute value through real world situations. They develop an examineing of when absolute value can be used in a given situation.
Curated OER
Let's Make Lemonade Lesson 3: What's the Big Idea?
Students examine and decide on a service-learning project to perform. They design and execute posters that advertise the project using geometric shapes.
Curated OER
The Power of Compounding
Sixth graders examine the concept of compounding interest on invested money. They explore how much interest their money would earn through compounded interest. Students conclude that they should invest early and often.
Curated OER
Parabolas Exist Where?
Students recognize how parabolas are used in architecture and calculate a constant of variation.
Curated OER
The Demise of Copper's Trading Power
Eighth graders evaluate statistical equations. They examine data from archaeologists at Jamestown, complete statistical equations using the sets of data, and graph the results.
Curated OER
Modeling Population Growth
Students investigate the reasons for taking a census and determine the problems that are involved in the process. They examine the population figure for Montana and Lake county before using the information to complete the included...


