Alabama Learning Exchange
There's Gold in Them There Hills
Need to build a laser fence on Mars? In this cute maximizing-area lesson, young explorers pretend to be prospectors on Mars and must determine the best way to use 20 meters of fencing in order to maximize their area. In addition,...
Curated OER
Reading Graphs
Working independently or in teams, your class practices connecting graphs, formulas and words. This lesson includes a guided discussion about distance vs. time graphs and looking at how velocity changes over time.
EngageNY
Completing the Square (part 1)
Avoid the trap of memorizing steps when completing the square with a resources that provides a conceptual approach to completing the square. Learners that are able to recognize a perfect square trinomial are ready to complete the...
Curated OER
How Long Can You Go?
Eighth graders examine the usefulness of a line of best fit by collecting and graphing data, using a graphing calculator to determine the line of best fit, and making a variety of predictions. They watch a video, then design a...
NASA
Lights on the International Space Station
Groups explore illumination with NASA's Lighting Environment Test Facility (LETF) as a context. Using the TI-Nspire app, groups determine the lux equation that models their simulation. They then use the lux equation to...
Texas Instruments
Exploring Basic Equations
Learners explore equations with constants, variables and with exponents. They identify and define variables, constants, exponents, expressions, and equations, as well as give an example of each. Your class will also draw their...
Curated OER
How Alike Are We?
Fourth graders find the range, mode, median, and mean for each of the data sets (height and shoe size). They discuss which measure of central tendency for each data set best represents the class and why. Students graph the shoe size and...
Virginia Department of Education
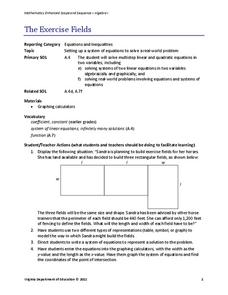
The Exercise Fields
Horses need exercise, too. Scholars create linear equations to model the perimeter of exercise fields for horses. They finish by solving their equations for the length and width of the fields.
Curated OER
Adding and Subtracting Algebraic Expressions (Combining Like Terms)
Everyone loves math when it includes food! This lesson tries to take the notion of combining like terms in algebra and comparing it to sorting apples and oranges. It takes a step-by-step approach to helping students understand this...
Curated OER
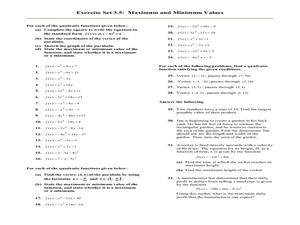
Maximum and Minimum Values
In this Algebra II worksheet, 11th graders complete the square to write a quadratic equation in Standard form. Students identify the vertex, sketch the graph and state the maximum or minimum value of the functions. The one...
Curated OER
Vertical and Horizontal Translations
Students analyze function graphs. In this Algebra II/Pre-calculus lesson, students investigate the graph of a function as they determine to which family of functions it belongs, determine the parent function and describe the...
Curated OER
Get a Half-life!
Pupils explore decay functions and the half-life of a substance. Through an M&M activity with calculators, students collect and graph data. They determine the linear, quadratic and exponential functions of the graph. Pupils...
Curated OER
Lesson 1: Exploring Quadratic Graphs
Students, using a specified website, plot quadratic curves to distinguish how different values of a affect a graph. They investigate how the constant and the absolute value of a function affects the graph. They identify the parabola...
Shodor Education Foundation
InteGreat
Hands-on investigation of Riemann sums becomes possible without intensive arithmetic gymnastics with this interactive lesson plan. Learners manipulate online graphing tools to develop and test theories about right, left, and...
EngageNY
Relationships Between Two Numerical Variables
Is there another way to view whether the data is linear or not? Class members work alone and in pairs to create scatter plots in order to determine whether there is a linear pattern or not. The exit ticket provides a quick way to...
EngageNY
Obstacles Resolved—A Surprising Result
The greater the degree, the more solutions to find! Individuals find the real solutions from a graph and use the Fundamental Theorem of Algebra to find the remaining factors.
Kenan Fellows
Lego Thinking and Building
Run a simulated airplane manufacturing plant with your pupils as the builders! Learners build Lego airplane models and collect data on the rate of production, comparing the number produced to the number defective. Using linear...
Bowland
Torbury Festival
Have you been to Torbury Fair? In the set of four lessons, learners solve a myriad of problems related to a music festival, including situations involving floods, market stalls, cows, and emergency plans.
West Contra Costa Unified School District
Polynomial Division
How do you apply the traditional division algorithm to polynomials? Here is an Algebra II lesson that extends the use of the division algorithm to polynomials. After establishing the concept of long division, synthetic division and the...
Curated OER
Quadratic Functions
Students graph quadratic equations on paper and check their results on the graphing calculator. They predict the direction of the graph and the vertex point. Students use the vertex, axis of symmetry and knowledge of which direction the...
Curated OER
The Factor Connection
Pupils investigate the connection between factors, zeros, and graphs of quadratic functions. The lesson plan requires the TI-nspire handheld.
Curated OER
Storefront Signs
Learners practice finding the areas and patterns within a square and explore the concept of quadratic functions. They observe and record the area values in a table, plot a graph of Area versus Distance and complete a variety of student...
Curated OER
Let's Play Some Ball!
Pupils review horizontal and vertical shifts of a parabola and how they effect a specific quadratic formula. They play a basketball review game in which they try to find the right quadratic equation for a given problem in order to earn...
Curated OER
Don't Let Parabolas Throw You
Young scholars identify relation, function, patterns and range. In this algebra lesson plan, students factor and graph quadratic equations. They use transformation to move the parabola around and make predictions.


