Curated OER
Algebra 2 Test
In this algebra instructional activity, students solve problems involving functions, systems and conics. They simplify radicals and graph parabolas identifying the focus and ellipse. There are 20 questions.
Curated OER
Reflections of a Quadratic Function
Students compare transformations of a quadratic function on a graph and determine equations of a quadratic functions based on a reflection. They graph a transformation of a function based on reflections. They etermine if a function is...
Curated OER
Graphs and Functions
Students are introduced to plotting functions on the Cartesian coordinate plane seen several categories of functions, including lines and parabolas
Curated OER
Discriminant Testing
The class works to identify solutions using the discriminant.They use part of the quadratic formula to find the number of solutions a quadratic equation will have. They calculate how-many times the quadratic function will cut the x-axis....
Curated OER
Finite Differences
Young mathematicians solve problems with polynomials. As they graph and analyze polynomial functions, learners define constant and finite, and determine the relationship between the constant set of differences and the slope of a linear...
Curated OER
Get Your Numbers in Shape - TI-83
High Schoolers use the TI-83 calculator to produce a sequence, explore patterns and find a linear or quadratic equation for a given pattern. They use inductive reasoning to make conjectures about patterns. They find the Y-value of a...
Curated OER
Maximum, Minimum, Increasing, Decreasing
Learners practice with the StudyCard set on assessing real-world contexts dealing with the concepts of maximum, minimum, increasing and decreasing. They view a variety of quadratic functions and equations with their TI-83 Plus calculators.
Curated OER
Collecting Ball Bounce Data
Learners investigate quadratic equations as they use a CBR to collect and analyze data regarding a bouncing ball. Pupils explore different methods for determining the equation of the parabolic path including quadratic regression and...
Curated OER
Strike a Pose: Modeling in the Real World (There's Nothing to It!)
Adjust this lesson to fit either beginning or more advanced learners. Build a scatter plot, determine appropriate model (linear, quadratic, exponential), and then extend to evaluate the model with residuals. This problem uses real-world...
Curated OER
Factoring Trinomials
Have the class factor and solve trinomials of integers in the form x2 + bx + c, where b and c are positive. They relate factoring to area and then follow a specific format to factor their trinomials. Tiles are used to help them relate...
Curated OER
Completing the Square Algebraically
Using TI-Nspire, scholars rewrite quadratic expressions by completing the square. They change the equation into vertex form. By the end of this lesson, they should be able to change any quadratic equation into vertex form.
Curated OER
Parabolic Equations
In this parabolic worksheet, students write an equation of a parabola which satisfies given conditions. They match equations to the correct graph. Students identify the vertex, domain and range of an equation. This one-page worksheet...
Curated OER
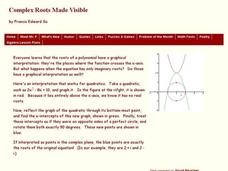
Complex Roots Made Visible
In this algebra worksheet, 11th graders solve quadratic functions using the quadratic formula. They identify the negative roots using complex roots. There is an answer key with this problem.
Curated OER
Graphs
For this algebra worksheet, students solve linear equations through graphing and quadratic equations through factoring. There are 4 questions dealing with systems of equations.
Curated OER
Surface Area of a Leaf (Grades 7-9)
In this math and science worksheet, students read about the process of photosynthesis and plant growth. They determine how a plant's ability to create food is dependent on the surface area of its leaves using geometric calculations. They...
Alabama Learning Exchange
I'm Lovin' It: Finding Area Between Curves
Students explore the concept of finding the area between two curves. In this finding the area between two curves instructional activity, students model the logos of McDonalds, Nike, and Motorola on grid paper. Students find functions to...
Curated OER
TI-89 Activities for PreCalculus and AP Calculus
Using the TI-89 calculator, young scholars explore the statistical, graphical and symbolic capabilities of the TI-89. Students investigate topics such as solving systems of equations, finding inverse functions, summations, parametrics...
Alabama Learning Exchange
Technology for Displaying Trigonometric Graph Behavior: Sine and Cosine
Young scholars explore the concept of sine and cosine. In this sine and cosine lesson, students work in groups to graph sine and cosine functions. Young scholars examine how coefficients in various parts of each parent function shift...
Curated OER
Extra Review
In this quadratic formula worksheet, students solve and complete 22 different types of problems. First, they solve each equation by completing the square and applying the quadratic formula. Then, students graph each function provided and...
Curated OER
Factoring Trinomials
Students factor trinomials and other quadratic functions. In this algebra lesson, students solve trinomials containing negative and positive coefficients. They factor quadratics of difference squares as well as regular polynomials.
Curated OER
Fundamental Theorem of Algebra
In this activity, learners identify the Fundamental Theorem of Algebra. They solve polynomial functions and simplify expressions and equations.
Curated OER
Extraneous Solutions
High schoolers find the roots of quadratic equations. In this algebra lesson, students solve radical equations and identify the positive and negative roots. They graph and analyze their functions.
Curated OER
Multiplying Monomials
Students differentiate between linear and quadratic functions. In this algebra lesson, students write equations of graphs and graph a function from an equation. They also identify the slope and y-intercept.
Curated OER
Curve Fitting
Pupils investigate linear, quadratic, and exponential regressions. They plot sets of data points, determine the regression equation that best fits the data and lastly investigate the coefficient of determination.


