Curated OER
Discovering Pi/Welcome to Pi Day
Students explore pi. In this circle measurement lesson, students define and identify radius, diameter, circumference, and perimeter. Students work in groups to measure several plastic lids and record their findings. Students compare the...
Curated OER
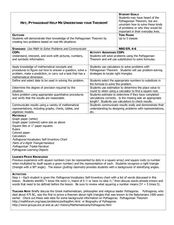
Hey, Pythagoras! Help Me Understand Your Theorem!
Learners explore the Pythagorean Theorem. In this math lesson, pupils solve problems using the Pythagorean Theorem. They select the appropriate numbers to substitute in the formula to solve problems.
Mathematics Assessment Project
Sorting Equations of Circles 2
How much can you tell about a circle from its equation? This detailed lesson plan focuses on connecting equations and graphs of circles. Learners use equations to identify x- and y-intercepts, centers, and radii of circles. They also...
Curated OER
A Tale of Two Stories
Students develop their classification and math skills using the stories "The Three Little Pigs" (Galdone 1970) and "Cinderella" (Grimm and Grimm 1981). They compare the two stories using venn diagrams, simple maps, and problem solving.
Visa
Bank or Bust: Selecting a Banking Partner
Why shouldn't we just save all our money in our mattress? Couldn't our money disappear? Pupils discover the benefits of utilizing banks and credit unions for saving money, as well as how to evaluate different types of institutions by...
Curated OER
Trajectory Perplexity
Students investigate measuring angles correctly through projectiles. For this geometry lesson, students launch a projectile to investigate the importance of how to measure an angle correctly and to explore trajectory. They collect data...
Curated OER
Multicultural Math Project
Sixth graders examine where mathematics came from. In this Math History lesson, 6th graders complete various activities to understand mathematical reasoning. Students complete critical thinking questions.
Curated OER
Problem Solving and the Sports Page
The use of box scores from baseball games is the foundation of this math lesson. Organize your class into groups of four, and give identical box scores from a baseball game that was just played. Have them create word problems from the...
Curated OER
Use a Number Line to Add
Your first and second math class will develop a higher understanding of addition after using the number line. Word problems are provided, and learners use the number line to illustrate and solve each problem. For advanced learners,...
Curated OER
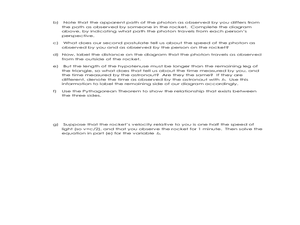
Time Dilation and Geometry
Students solve problems of dilation and velocity. In this geometry lesson, students apply the Pythagorean Theorem to solve problems and relate it to time and velocity.
Curated OER
Define Geometry Terms
The Common Core is intended to help all children meet high academic standards. Here is a Common Core designed lesson that is intended for learners with communication or language difficulties. The lesson is written in a narrative style...
Curated OER
Compound Inequalities and Graphing
Put geometry skills to the test! Learners solve compound inequalities and then graph the inequalities on a coordinate plane using their geometric skills. They identify the slope and y-intercept in order to graph correctly. I like this...
Curated OER
Barbie Bungee
Middle and high schoolers collect and analyze their data. In this statistics lesson, pupils analyze graphs for linear regression as they discuss the relationship of the function to the number of rubber bands and the distance of the...
Curated OER
Patterns in Pascal's Triangle
Young scholars examine the patterns in Pascal's Triangle. In this recognizing lesson, students view a model of Pascal's Triangle and describe the patterns of the multiples. Young scholars identify the shapes that are made within Pascal's...
EngageNY
Proving the Area of a Disk
Using a similar process from the first lesson in the series of finding area approximations, a measurement resource develops the proof of the area of a circle. The problem set contains a derivation of the proof of the circumference formula.
EngageNY
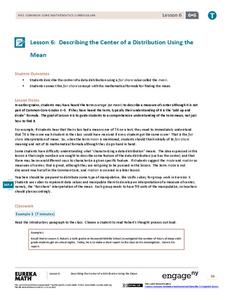
Describing the Center of a Distribution Using the Mean
Everyone does their fair share. The sixth segment in a 22-part unit presents the mean as a fair share. Groups build a conceptual understanding of the mean of a data set, rather than simply learn an algorithm. Learners use the...
Curated OER
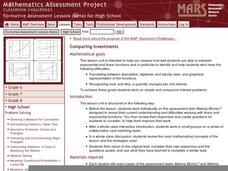
Comparing Investments
Money, money, money. A complete lesson that makes use of different representations of simple and compound interest, including written scenarios, tables, graphs, and equations to highlight similarities and differences between linear and...
EngageNY
Differences Due to Random Assignment Alone
It takes a lot of planning to achieve a random result! Learners compare results of random assignment, and conclude that random assignment allows results to be attributed to chance. They also realize the set of random means are clustered...
EngageNY
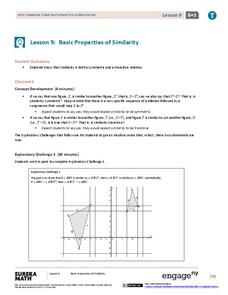
Basic Properties of Similarity
Does the symmetry and transitive property apply to similarity? The 10th segment in a series of 16 presents the class with a group of explorations. The explorations have pairs show that similarity is both symmetrical and transitive. It...
Curated OER
Reading Graphs
Working independently or in teams, your class practices connecting graphs, formulas and words. This lesson includes a guided discussion about distance vs. time graphs and looking at how velocity changes over time.
Curated OER
Unexpected Answers
Students explore the concept of fairness. In this fairness lesson plan, students play four probability games. Students determine who has the best chance of winning each of the four games. Students discuss which games gave an unfair...
Curated OER
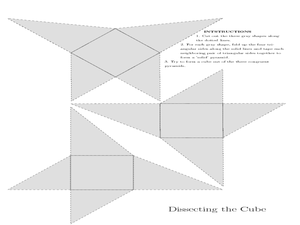
Dissecting the Cube
Students investigate the volume of cones. In this geometry lesson, students define the formula to find the volume of cones. They define the concept of having to dissect a three dimensional figure and find the volume.
EngageNY
Recursive Challenge Problem—The Double and Add 5 Game
Math is all fun and games! Use a game strategy to introduce the concept of sequences and their recursive formulas. The activity emphasizes notation and vocabulary.
Curated OER
Representing Data 1: Using Frequency Graphs
Here is a lesson that focuses on the use of frequency graphs to identify a range of measures and makes sense of data in a real-world context as well as constructing frequency graphs given information about the mean, median, and range of...


