Illustrative Mathematics
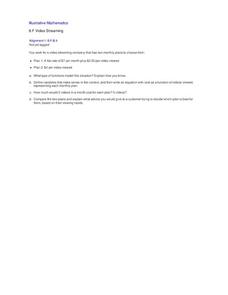
Video Streaming
Your movie fans will be interested in this resource. They will compare video streaming plans. One plan charges a set rate per month and a reduced viewing fee, and the other has a flat rate per each video viewed. Unfortunately, learners...
Curated OER
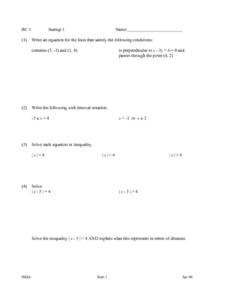
Startup 1: Functions & Interval Notation
In this function worksheet, students write an equation of a line. They solve inequalities and write functions with interval notation. This two-page worksheet contains approximately 20 problems.
Curated OER
The Number Line
Eighth graders investigate the order of numbers and how they are located on the number line. They also review the symbols used to compare quantities in order to decipher simple expressions and graph them on the numberline.
Curated OER
Compound Inequalitites
Learners graph compound inequalities. In this algebra lesson, students solve equations with inequalities and graph the results on a number line. They distinguish between "or" and "and"
Curated OER
Inequalitities Mixed Review
Students solve inequalities and graph it on a number line. In this algebra activity, students rewrite word problems into algebraic equations and graph it using compound inequalities.
Curated OER
Cinco De Mayo
Students make a graph identifying the immigration of Mexicans to the US. In this algebra lesson, students practice graphing as they review different trends in immigration over the past 100 years. They interpret and analyze their graphs.
Curated OER
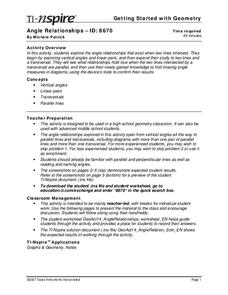
Angle Relationships
Tenth graders explore the angle relationships that exist when two lines intersect. For this geometry lesson, 10th graders estimate the measure of given angles and use their graphing calculator tools. Students use this knowledge to find...
Curated OER
Absolute Value
In this algebra worksheet, young scholars solve absolute value equations through graphing and algebraically. There are 50 questions.
EngageNY
Exponential Decay
I just bought that car, how can its value decrease already? Individuals use the data of a depreciating car value to create an exponential decay model. They then compare exponential decay and growth equations.
Curated OER
Newton's Law of Cooling
Your Algebra learners analyze and solve an exponential equation in this popular, real-life model of the cooling of a liquid.
Curated OER
Linear Programming and the Inequalz App
Learners graph system of linear inequalities in this lesson. Your class will use the Inequality Graphing App to enter linear programming functions into the calculator that can be stored for later use. They then determine the maximum for...
Curated OER
Balanced Or Unbalanced
Students use physical models and graphs in order to solve problems that have their origin in the real world that require algebraic thinking. The words are changed into equations and inequalities in order to be solved. This requires...
Curated OER
Integrated Algebra: State Exam
In this integrated algebra worksheet, students solve problems related to topics covered in algebra for the entire year. Topics include, but are not limited to, inequalities, probability, functions, interval notation, exploring...
Curated OER
Curve Fitting and the TI-85 Calculator
Seventh graders follow a step-by-step guide for using graphing calculator to determine equations which best fit data graphed. They gather data from various sites on the web, or they do searches to find information necessary to complete...
Curated OER
Integrated Algebra Final Exam
In this integrated algebra worksheet, students solve problems involving system of equations, quadratic equations, inequalities, surface area, and radicals. This 28-page worksheet contains 39 multi-step problems.
Curated OER
Populations Lab - Exponential Graphing
Ninth graders investigate the application of populations that exists in one's everyday environment, in order to develop an understanding of how mathematics is a key component in the understanding of population dynamics.
Curated OER
Lesson 2: The Quadratic Equation
Pupils graph quadratic equations. They use interactive graphs, on CD-ROM, to answer specific equations. Students identify the vertex of a parabola and the axis of symmetry.
Curated OER
Tallies Tell It All
Students explore data collection through the use of tally marks. After a demonstration of the use of tally marks students complete various inquires where they create a chart documenting the number of times a desired result happens. They...
Curated OER
College Prep Worksheet Chapter 2, 2.1-2.4, 2.6, 2.8 & 7.5
In this algebra worksheet, learners identify the coefficient, simplify expressions, solve algebraic equations, and graph inequalities. This worksheet contains 93 equations, with an answer key.
Curated OER
Absolute Value Equations and Inequalities
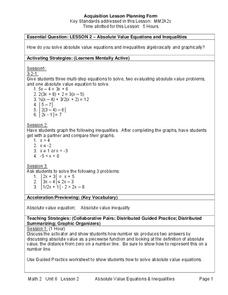
Students explore the concept of absolute value inequalities and equations. In this absolute value inequalities and equations instructional activity, students discuss how to solve absolute value inequalities and equations through teacher...
Curated OER
Solving Systems of Equations by graphing for Algebra One
Students watch the teacher demonstrate on an overhead projector how to graph various equations before the students try them on their own. They start with pencil and paper; once they grasp the concept they move on to punching in the...
Curated OER
Graphing With Second Graders
Second graders sort M & M's and then enter the data into a spreadsheet in order to create a simple graph. After printing the spreadsheet generated graph, have students compare the printed graph with their paper graph.
Curated OER
Graphing Equations
Students use an interactive website or cd rom to graph equations. The lesson plan is not very clearly written. The use of the website is essential or the educational software that can be purchased from the Prentice Hall publisher.
Curated OER
Border Patrol ID: 11603
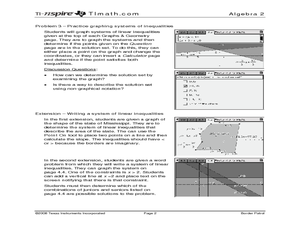
Incorporate technology in your classroom by teaching your learners how to graph systems of linear inequalities as they apply to an area of land. The lesson plan provides an extension in which students are challenged to write a...


