Federal Reserve Bank
Less Than Zero
Perry the penguin wants to buy a new scooter, but he doesn't have any funds! Walk your kids through the short book Less Than Zero, and have them track his borrowing, spending, and saving on a line graph while you read. Pupils will learn...
EngageNY
Finding Systems of Inequalities That Describe Triangular and Rectangular Regions
How do you build a polygon from an inequality? An engaging lesson challenges pupils to do just that. Building from the previous lesson in this series, learners write systems of inequalities to model rectangles, triangles, and even...
02 x 02 Worksheets
Absolute Value Equations and Inequalities
Demonstrate the meaning of an absolute inequality using three different methods. Here, scholars explore absolute value inequalities through graphing, number line distance, and compound inequalities. Pupils complete various activities to...
Curated OER
Solving multi-step inequalities and solving systems by elimination
Students solve multi-step equations and apply the process of elimination. In this algebra lesson, students solve linear inequalities and equations using linear combination and evaluation. They graph their results on a number line...
West Contra Costa Unified School District
Connecting Graphing and Solving Absolute Value Equations and Functions
Can you solve an equation graphically? Absolutely! This Algebra II lesson makes the connection between solving an absolute value equation and graphing two functions. Graphing absolute value functions is presented through the process of...
Curated OER
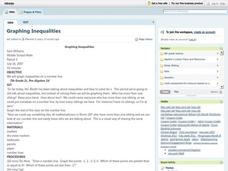
Graphing Inequalities
Students graph inequalities on a number line and discuss how to solve for one variable. The teacher models examples as students take notes. In groups, students participate in an activity to demonstrate inequalities on a number line. ...
Virginia Department of Education
Inequalities
Compare graphing an inequality in one variable on a number line to graphing an inequality in two variables on a coordinate plane. Young mathematicians work on a puzzle matching inequalities and their solutions. They then complete a...
Curated OER
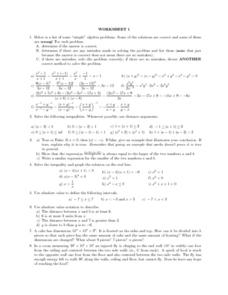
Worksheet 1: Algebra and Inequalities
Challenge your students' algebra skills with this activity, which presents students with several types of problem sets, including solving inequalities, graphing, word problems, and a set of algebra problems that may or may not require...
Curated OER
Intersections, Unions, and Compound Inequalities
In this algebra worksheet, students graph inequalities on number lines. Two problems are written in interval notation. The other five problems require students to graph and then write in interval notation.
Curated OER
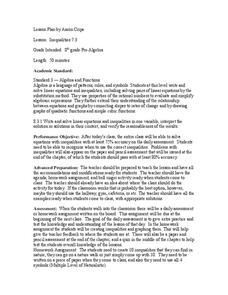
Inequalities 7.3
Graph inequalities and discuss the difference in their slopes. Learners observe rate of change as they compare linear, quadratic, and cubic functions.
Curated OER
An Introduction To Solving And Graphing Inequalities
Students graph inequalities and solve the equations. In this algebra lesson, students graph their solutions on a number line and create an inequality for a word problem.
Curated OER
Systems of Equations and Inequalities
This is a comprehensive lesson on creating and solving equations and systems of equations and inequalities. Problems range from basic linear equations to more complex systems of equations and inequalities based on a real-world examples....
Curated OER
Linear Inequalities in Two Variables
Graph and solve linear equations in two variables. The class relates the concepts of linear equations to the real world.
Curated OER
Solving Inequalities and Graphing on a Number Line
Students review solving equations. They solve an inequality and discuss how to graph it. Students work together on one inequality and then graph two on their own. This instructional activity contains links to a PowerPoint and a worksheet.
National Security Agency
Systems of Equations and Inequalities
High school classes can use manipulatives too! Offer hands-on, interactive lessons that venture away from the typical day in your algebra class. Young mathematicians will be involved in collaborative learning, visual...
EngageNY
Perimeter and Area of Polygonal Regions Defined by Systems of Inequalities
When algebra and geometry get together, good things happen! Given a system of inequalities that create a quadrilateral, learners graph and find vertices. They then use the vertices and Green's Theorem to find the area and perimeter of...
Curated OER
Linear Inequalities
Through exploration of linear programming through graphs and equations of inequalities, students relate linear programming to real life scenarios, such as business. Graphing and shading is also part of this exercise.
Curated OER
Graphing Systems of Inequalities
Solve equations and graph systems of inequalities. Designed as a instructional activity to reinforce these concepts, learners revisit shading and boundaries along with solving linear inequalities.
Curated OER
Compound Inequalities and Graphing
Put geometry skills to the test! Learners solve compound inequalities and then graph the inequalities on a coordinate plane using their geometric skills. They identify the slope and y-intercept in order to graph correctly. I like this...
Curated OER
Relations and Graphs
Here is a simple, yet clever lesson on how to teach the important concepts of greater than, less than, and equal to. Pupils write their names down on grid paper - one letter per box. They compare their names and find a name that is...
EngageNY
Introduction to Simultaneous Equations
Create an understanding of solving problems that require more than one equation. The lesson plan introduces the concept of systems of linear equations by using a familiar situation of constant rate problems. Pupils compare the graphs of...
Curated OER
Simple Inequalities
Students solve inequalities. In this inequalities lesson, students evaluate simple inequalities. They examine vocabulary words. Students participate in breath holding activities and write inequalities to represent the activity. In teams,...
Curated OER
Graph It!
There is more than one way to represent data! Learners explore ways to represent data. They examine stacked graphs, histograms, and line plots. They conduct surveys and use stacked graphs, histograms, or line plots to chart the data they...
Curated OER
Chocolate Graphing
Chocolate lovers develop a bar graph based on the types of chocolate the class likes. They participate in The Art of Chocolate at The Hershey Story before they make a bar graph that shows the favorite chocolate types of their class. They...


