Curated OER
Graphing Linear Equations
In this math instructional activity, students practice solving systems of linear equations using the elimination and substitution methods. They also graph the solutions.
Curated OER
Graphing Linear Equations on the TI
Learners graph linear equations on the TI calculator. In this algebra lesson, students rewrite equations in the slope intercept form and use the calculator to graph their problem. They work together to interpret the graphs off of the TI.
Curated OER
Solving Inequalities
Eighth graders participate in a lesson that covers the concept of an algebraic inequality. They practice recognizing the symbols used in an inequality and solving them using the methods that are similar to solving equations.
Curated OER
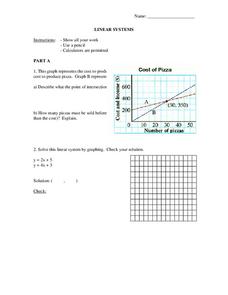
Solving Systems by Graphing
In this Algebra I/Algebra II worksheet, learners solve a system of linear equations by graphing. The one page worksheet contains one problem. Answer is provided.
Curated OER
Unit 4: Worksheet 4: Functions and Graphs
In this function and graph activity, students read and interpret maps and graphs. They write an equation, define variables and solve the equation. Students solve diamond problems and use the distributive property to solve equations. ...
Curated OER
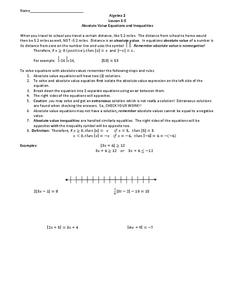
Absolute Value Equations and Inequalities
In this Algebra II activity, 11th graders solve and graph the solutions to absolute value equations and inequalities. The two page activity provides explanation and examples in addition to sixteen practice questions. Answers are not...
Curated OER
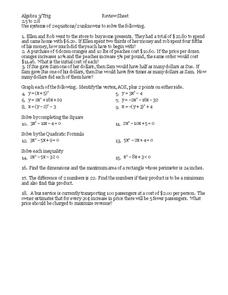
Inequalities
In this inequalities learning exercise, 9th graders solve and complete 18 different types of problems. First, they use systems of 2 equations/2 unknowns to solve each word problem shown. Then, students graph each and identify the vertex...
Curated OER
Slopey Math
Students identify the slope of a line and use it to solve real life problems. In this algebra activity, students write linear equations in slope intercept form and make a correlation to its relation to the real world. They use the slope...
Curated OER
Graphs and Spreadsheets
Students collect data and present it in a graph and/or a spreadsheet, depending on their previous understanding of technology.
Curated OER
Math Instructional Technology Information
Students investigate the correlation between education and salary. In this business instructional activity, students analyze the salary rate for different jobs to determine if there is a correlation between the two. They graph their...
Curated OER
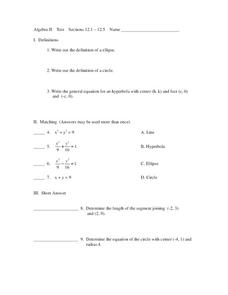
Conics and Graphing
In this algebra worksheet, students solve equations by graphing an ellipse, circle and hyperbola. They match equations to graphs and define each type of function. There are 20 questions total.
Curated OER
Math Morphing Proximate and Evolutionary Mechanisms
Students identify the different types of fractals. In this geometry lesson, students use math to analyze different biological phenomena. They collect data from the experiments and construct graphs.
Curated OER
Border Patrol
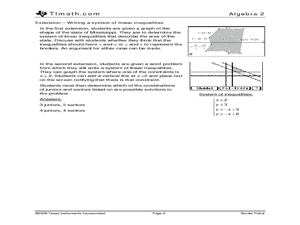
Young scholars investigate systems of linear inequalities as they apply to an area of land. They practice graphing systems and determine if a point lies in the solution.
Curated OER
Functions of Algebra
Students use technology graph and evaluate linear inequalities. They write and manipulate inequalities for use on a graphing calculator. In addition they apply their skills to analyze inequalities. Answer Key included.
Curated OER
Hassan's Pictures - Linear Programming and Profit Lines
Students graph systems of linear inequalities. In this linear programming and profit lesson, students explore linear programming problems. They graph a feasible region in a linear programming problem and identify the profit lines. ...
Curated OER
M & M Madness
Students work with the mathematics unit of collection, organization, and presentation of data. In this math and technology lesson plan, students use Valentine M & M’s and The Graph Club to sort and graph the various colored M & M’s.
Curated OER
Exploring Quadratic Equations
By stretching and translating the parabola given and determining the effects on the equation, students explore finding the vertex and zeros of a parabola and relate them to the equation. Students also view the intercept form to determine...
Curated OER
Final Exam Review: College Algebra
In this final exam review worksheet,s students solve systems of equations, polynomials and factor quadratic equations. They identify the slope of a line and write linear equations. Students use Cramer's rule, graphing, substitution,...
Pennsylvania Department of Education
Use Order of Operations to Evaluate Expressions—No Grouping Symbols
Students identify and explain different types of data collection and graphs. For this graphs and data collection lesson, students record their observations of a variety of data collection tools and graphs displayed in the room. Students...
Pennsylvania Department of Education
Equal Groups
Students explore statistics by completing a graphing activity. In this data analysis lesson, students define a list of mathematical vocabulary terms before unpacking a box of raisins. Students utilize the raisins to plot data on a line...
Curated OER
Linear Inequalities
Ninth graders practice recognizing similarities and differences found in the graphing of inequalities and equations. Once observatioons are made they solve some of their own applying prior knowledge.
Curated OER
Rational Function Graphs
Students use algebraic methods to represent and solve problems. Using a graphing calculator, students solve rational and inequality problems. They visually demonstrate solutions of functions through graphing. Students answer questions...
Curated OER
M&M Graphing and Probability
Students create a variety of graphs. They count, sort, and classify M&M's by color and record data on a chart. They use data from the chart to create pictographs, bar graphs and circle graphs. They analyze data and determine...
Virginia Department of Education
How Much is that Tune?
Tune in for savings! Scholars investigate pricing schemes for two different online music download sites. After comparing the two, they determine the numbers of songs for which each site would be cheaper.


