Curated OER
Linear Programming
Students explore inequalities to determine the optimal solution to maximize a profit for a company. In this linear programming lesson plan, students discover how to graph inequalities and how to determine the algebraic representation of...
EngageNY
Solution Sets for Equations and Inequalities
How many ways can you represent solutions to an equation? Guide your class through the process of solving equations and representing solutions. Solutions are described in words, as a solution set, and graphed on a number line....
Illustrative Mathematics
Telling a Story With Graphs
Turn your algebra learners into meteorologists. High schoolers are given three graphs that contain information about the weather in Santa Rosa, California during the month of February, 2012. Graph one shows temperatures, graph two...
West Contra Costa Unified School District
Solving Equations Using Balance Scale, Decomposition, and Graphing
There's more than one way to solve an equation — three, actually. Scholars learn how to solve simple linear equations in one variable using three different methods, which include using balance scales, using decomposition (e.g., turning...
Curated OER
Graphing Standard Form Inequality
Young scholars solve equations and graph it. In this algebra lesson, students solve inequalities and rewrite them in the slope intercept form. They graph the boundary lines first either as dashed or solid and shade the correct side of...
Curated OER
Inequalities Compound Fram
Students practice graphing compound inequalities. They draw a Venn Diagram on two different sports visualizing that their is a middle section on commonality among the two sports groups and then relate that concept to compound inequalities.
Illustrative Mathematics
Puzzle Times
Give your mathematicians this set of data and have them create a dot plot, then find mean and median. They are asked to question the values of the mean and median and decide why they are not equal. Have learners write their answers or...
Curated OER
Linear Inequalities
Young scholars solve linear inequalities. In this solving linear inequalities lesson, students solve one step inequalities algebraically. Young scholars graph the solutions on a number line. Students compare the graphs of various...
Curated OER
Graphing Linear Equations and Inequalities
Students discuss methods to solve equations and inequalities with one variable. As a review, they write Addition and Subtraction properties of equality and Multiplication and Division properties of equality. Students graph points, write...
Curated OER
Doctor, Doctor, Give Me the News, I've Got a Bad Case of Loving Math
Solve a real-world problem of discovering how many doctors and nurses can be hired within budget and building constraints. Using different colored pencils to shade each graph, they then find the intersection points and use these to solve...
Illustrative Mathematics
Fishing Adventures 1
Often inequalities exist in many real-world contexts but young math learners struggle with understanding how to represent that relationship in a simple equation using an inequality. This activity focuses on the basic concepts by using...
Curated OER
Graphing
Fifth graders practice using math graphs. For this graphing lesson, 5th graders work in groups to develop a topic of their own to represent as a graph. Students collect data and construct a graph for the lesson.
Illustrative Mathematics
Fishing Adventures 2
This resource is part of a series which expects participants to be familiar with graphing inequalities on a number line. It is a word problem that asks your class to graph a discrete solution set and interpret it in the context of an...
Virginia Department of Education
Nonlinear Systems of Equations
Explore nonlinear systems through graphs and algebra. High schoolers begin by examining the different types of quadratic functions and their possible intersections. They then use algebraic methods to solve systems containing various...
Curated OER
Linear Inequalities in One and Two Variables: Rays and Half Planes
Define rays and half planes, including the concepts of boundary lines and prerequisite knowledge of coordinate planes. Given linear inequalities in one and two variables, your class will compare the differences. They will also graph...
Curated OER
Inequalities in Two Variables
In this algebra worksheet, students solve and graph 3 linear inequalities on coordinate systems. They solve and graph 3 systems of linear inequalities on a coordinate grid.
Curated OER
Two-Variable Linear Inequalities
Here is an engaging lesson on solving equations with two variables. Have the class rewrite linear equations in the slope intercept form, y=mx + b. They graph the lines using the slope and y-intercepts.
Curated OER
College Prep Algebra, Inequalities
In this algebra worksheet, learners solve and graph 10 linear inequalities. Students must remember to alter the inequality when the negative sign is on the variable.
Curated OER
Graphing Names in Historic Cemetery
Young scholars collect information from headstones about names of the deceased in their local community. They determine the most common names and graph them. They discuss their findings with the class.
Curated OER
Graphing Inequalities and Shading
Students graph and shade inequalities. In this algebra lesson, students graph inequalities using the slope-intercept form. They shade the side of the line that is the solution and identify the domain and range.
Curated OER
Using Graphs and Charts
Students complete T charts and manipulate numbers using graphs and charts. In this math graphs and charts activity, students review the concepts of pattern and function. Students then complete practice pages where they manipulate numbers...
Curated OER
What Functions do Two Graph Points Determine?
Your algebra learners write linear, exponential, and quadratic equations containing the same two graph points in this collaborative task.
Curated OER
Graphing Linear Equations on the TI-73
Eighth graders work in pairs with a TI-73 graphing calculator to complete a multiple-choice review using the Classroom Performance System. Each team uses a remote unit to "click in" the answers. When all teams have completed the review,...
Curated OER
Graphing Inequalitites
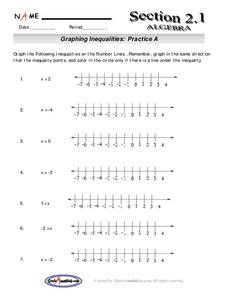
Ninth graders graph inequalities. In this algebra lesson, 9th graders graph equations on a number line using inequalities and plain numbers. They solve inequalities with negative numbers also.


