Curated OER
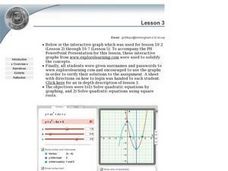
Lesson 3: The Quadratic Equation
Learners explore quadratic equations. They use interactive graphs (on the Internet) to verify and solve solutions. Students solve quadratic equations by using square roots. Learners examine examples of inequalities.
Curated OER
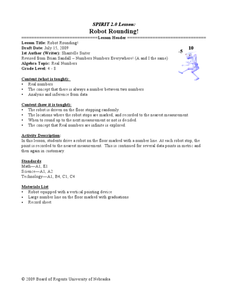
Robot Rounding!
Students collect data on a robot and relate the behavior to prove there is an infinite minute set of numbers. In this algebra lesson, students verify that there is always a number between two numbers. They analyze and make inference...
Curated OER
Jelly Belly: What a Wonderful "Bean"!
Students explore how jelly beans are produced. They discuss the origins of the jelly bean and view a video about how jelly beans are prepared, tested, shaped, finished, and shipped and estimate the amount of jelly beans in a jar and sort...
Curated OER
Earthquakes
Eighth graders demonstrate the mathematical components of a scientific problem as well as illustrate how real world problems can be solved using math. They demonstrate math skills such as rate calculation, graphing, and linear equations.
Curated OER
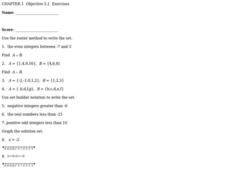
Integers
In this integers worksheet, students solve 10 different problems relating to integers. First, they use the roster method to write each set of even integers. Then, students use set builder notation to write the set of negative integers,...
Curated OER
Stem and Leaf Plots
In this stem and leaf plots worksheet, students solve and complete 10 different problems that include designing stem and leaf plots. First, they use the table on the left to determine the least score and the range of the total scores...
Curated OER
Which Bag is Which?
Students explore number sense by completing a statistical analysis game in class. In this data graphing lesson, students utilize visual references such as colored cubes and tiles to map out the results of an experiment outcome such as a...
Curated OER
Discovering Growth Patterns
Students explain the differences between linear (arithmetic) and exponential (geometric) growth. They use worksheets imbedded in this instructional activity to help them make predicitions and graph data points.
Curated OER
Choosing a Summer Job
What did you do over your summer vacation. Young wage earners must compare summer job options, and determine when each job earn the same amount and what that amount be. This be done by creating, graphing, and solving systems of...
Curated OER
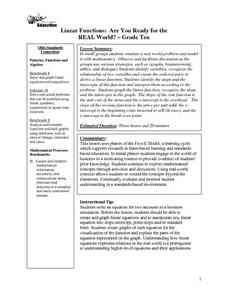
Linear Functions: Are You Ready for the REAL World?
students emulate a real world problem and model it with mathematics working in a small group. Observe and facilitate discussion as the groups use various strategies, such as (graphs, brainstorming, tables, and dialogue.
Curated OER
Bodacious Buttons
First graders graph a data set. Given a set of buttons, 1st graders sort them into categories using specific attributes. They graph the number of buttons in their set based on their attributes using a variety of graphs. Students share...
Curated OER
Properties of Curves
In this Calculus instructional activity, students use a graphing calculator to boost their understanding of functions and their graphs as they examine the properties of curves. The forty-two page instructional activity contains one...
Alabama Learning Exchange
Three in a Row Calendar Game
Students explore a calendar. In this calendar and math instructional activity, students view a video clip about using a calendar. Students participate in a game in which a game board is used to identify days of the week, dates, and months.
Curated OER
The Hudson's Ups and Downs-Hudson River Activity
For this Hudson River worksheet, students read a short passage about the river, compare graphs of water levels at different locations, label high and low tides on a graph and interpret, and answer comprehension questions based on several...
Curated OER
I Can Do This! Systems of Equations
Students solve systems of 2-by-2 linear equations using tables,
graphs and substitution. In small groups, classmates work together to discover strategies for solving equations. They use a calculator to graphically represent their answers.
Curated OER
Sunrise, Sunset: Quickly Go the Days
Students explore the concept of daylight. For this daylight lesson, students compare the amount of daylight on a particular day in Anchorage compared with daylight where they live. Students color maps of the US according to amount of...
Curated OER
The Kangaroo Conundrum: A Study of a Quadratic Function
Students play a game and collect data for their graph. For this algebra lesson, students solve quadratic equations and identify properties of their graph. They describe the pattern created by the graph and the game.
Curated OER
Slope Calculation
Young scholars compute the slope of a line based on the coordinates of two points on the line. In addition, they examine the relationship between the numerical value of slope and its properties on a graph.
Curated OER
Introduction to functions
In this functions worksheet, students plot points on a graph according to the rule. Students plot 7 points on each of the 2 graphs given to them.
Curated OER
Model Data with Quadratic Functions
Learners model data using quadratic equations. In this algebra lesson, students simplify and factor quadratic equations. They graph the function using collected data and analyze the parabola.
Curated OER
Ice Melting Investigation
Young scholars conduct an ice melting investigation in which they observe and measure the melting of two ice spheres. They develop a hypothesis as to which sphere will melt the fastest, collect data every ten minutes, and graph the data...
Curated OER
The Swinging Pendulum
Students observe a pendulum and graph their observation. In this algebra instructional activity, students use the TI calcualtor to graph the motion the pendulum makes. They analyze the graph and make predictions.
Curated OER
Data Analysis Self-Test
In this data analysis instructional activity, students complete 1 problem that has 7 parts involving mean, median, mode, range, and quartiles. Students then perform 5 operations with matrices.
Curated OER
Water in the Texas Coastal Basins
Students, after researching a Texas coastal basin, map and graph the information they collect and then translate it into a short report to be presented to their classmates. They brainstorm unique ways to maintain Texas estuaries as well...


