Mascil Project
Epidemics: Modelling with Mathematics
The Black Death epidemic is responsible for more than one million deaths in the United Kingdom. An inquiry-based activity has young scholars explore the rate of disease spread. They then analyze graphs showing data from epidemics such as...
Annenberg Foundation
Skeeters Are Overrunning the World
Skeeters are used to model linear and exponential population growth in a wonderfully organized lesson plan including teachers' and students' notes, an assignment, graphs, tables, and equations. Filled with constant deep-reaching...
Fredonia State University of New York
Watch Your Step…You May Collide!
Can two lines intersect at more than one point? Using yarn, create two lines on the floor of the classroom to find out. Cooperative groups work through the process of solving systems of equations using task cards and three different...
Curated OER
Equations and Inequalities
Students in a college algebra class use graphs to solve inequalities. Using the coordinate graphing system, they represent the relationship between x and y intercepts. They practice solving equations with complex numbers and locate...
Curated OER
Lesson 10: Graphs
Students explore graph theory. In this geometry lesson, graphs are used to solve problems in a variety of domains. In this lesson the term graph refers to a collection of vertices and edges used to depict...
Curated OER
M&M Graphing and Probability
Students sort, classify, and graph M & M's. They create pictographs and bar graphs with the colors and numbers in each bag of M & M's. They calculate the ratio and probability based on class results.
Curated OER
Functions and Graphing
Graphing functions in a real world application makes math come to life. Learners graph points on a coordinate plane and identify various points on a graph by working through a set of real world problems. This is a perfect review exercise.
Curated OER
Solving Inequalities and Graphing
Students solve and graph inequalities on a number line. For this algebra lesson, students solve using addition, subtraction, multiplication and division and graph their solutions using open or closed circles. They graph with 80%-90%...
Curated OER
Linear Inequalities
Ninth graders explore solving linear inequalities. They discuss vocabulary words and symbols associated with linear inequalities. After a demonstration by the teacher, 9th graders solve and graph inequalities. Students complete a...
Curated OER
Solving, Writing, and Graphing Linear Inequalities
In this linear inequalities worksheet, students solve inequalities, write inequalities in interval notation, and graph inequalities. Students also solve four word problems by writing and solving linear inequalities.
Curated OER
Simple Inequalities on a Number Line
Students solve inequalities problems. In this algebra lesson, students graph the solution of inequalities on a number line. They discuss boundaries and open or closed intervals.
Virginia Department of Education
Transformation Investigation
Graph it! Investigate transformations with a graphing calculator. Pupils graph sets of linear functions on the same set of axes. They determine how changes in the equation of a linear function result in changes in the graph.
Curated OER
Worksheet #5: Mixture Word Problems
In this mixture word problem worksheet, young scholars read story problems and determine what information is necessary to solve the mixture problem. They identify the correct solution, graph inequalities, and solve inequality equations....
Curated OER
Inequalities Involving Absolute Value
Students solve and graph inequalities involving absolute value. They discuss and identify the basic properties of inequalities, and solve basic examples.
Curated OER
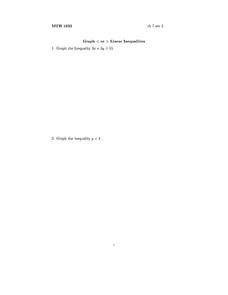
Graph Linear Equations
In this linear equation worksheet, students use basic operations to simplify and graph inequalities. This two-page worksheet contains three problems.
Virginia Department of Education
Equations of Lines
Scholars connect slope-intercept form and standard form to the values of m and b by first matching a set of cards that have slope-intercept form, standard form, values of m, values of b, and graphs of linear equations. They then...
Virginia Department of Education
Rational Functions: Intercepts, Asymptotes, and Discontinuity
Discover different patterns by making connections between a rational function and its graph. An engaging lesson asks scholars to explore the behavior of different rational functions. Groups discover a connection between the function...
EngageNY
Geometric Interpretations of the Solutions of a Linear System
An intersection is more than just the point where lines intersect; explain this and the meaning of the intersection to your class. The 26th segment in a 33-part series uses graphing to solve systems of equations. Pupils graph linear...
Polar Trec
How Much Data is Enough?
The next time you read a magazine or watch the news, make note of how many graphs you see because they are everywhere! Here, scholars collect, enter, and graph data using computers. The graphs are then analyzed to aid in discussion of...
NOAA
A Matter of Density
Larvae transportation on the New England seamounts is based on the density of the water. Scholars calculate density and graph salinity versus temperature to better understand the distribution of organisms in a water column....
K20 LEARN
Comparing Numbers And Fruit—More Or Less: Comparing Numbers
A discussion begins a lesson on comparing numbers. Pupils explain how they can show a number, then visit math centers to explore number-making tools. A story read-aloud of More or Less by Stuart Murphy identifies language for...
Curated OER
Systems of Linear Inequalities
The class solves systems of linear inequalities. They graph lines and identify the point of intersection.They graph lines and identify the boundary that represent the solution and solution set.
Curated OER
Introduction of Single and Multiple Linear Inequalities
Students solve linear inequalities. In this algebra lesson plan, students rewrite inequalities using one and two step equations. They graph their findings and identify the slope and solution of the line.
Curated OER
Systems of Linear Inequalities
In this systems of linear inequalities worksheet, 9th graders solve and complete 10 various types of problems. First, they determine whether a given point is in the solution set of a system of linear inequalities. Then, students graph...


