Curated OER
Nonlinear Inequalities
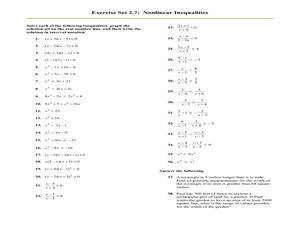
For this Algebra II worksheet, 11th graders solve nonlinear inequalities, graph the solution set on the number line, and write the solution in interval notation. The one page worksheet contains thirty-eight problems. Answers...
Curated OER
Less Than Zero
Students keep track of money. In this money management lesson plan, students read Less Than Zero by Stuart J. Murphy and manipulate a number line to keep track of spending and borrowing in the story.
Curated OER
“My Little Sister Hugged An Ape” | Literature, Math, & More!
Students read the story "My Little Sister Hugged An Ape" and make a list of sensory words from the story. For this interdisciplinary math lesson, students participate in sensory writing, and complete a questionnaire which they will use...
Curated OER
Absolute Value Inequalities
Students solve equations with absolute values. In this algebra lesson, students rewrite equations with absolute values to find the 2 values for x. They graph their solutions after solving for x.
Illustrative Mathematics
Peaches and Plums
According to the resource graph, which costs more: peaches or plums? Algebra learners compare two proportional relationships and then throw in a banana. Leaving out the scale helps students become intuitive about graphing.
EngageNY
Solution Sets to Equations with Two Variables
Can an equation have an infinite number of solutions? Allow your class to discover the relationship between the input and output variables in a two-variable equation. Class members explore the concept through tables and graphs and...
Curated OER
Review for the Final Exam - College Prep Algebra
In this algebra review worksheet, young scholars solve 100 open-ended and multiple choice problems. Students factor, simplify, graph, and solve inequalities, expressions, and equations.
West Contra Costa Unified School District
Correlation and Line of Best Fit
Computers are useful for more than just surfing the Internet. Pupils first investigate scatter plots and estimate correlation coefficients. Next, they use Microsoft Excel to create scatter plots and determine correlation...
Shodor Education Foundation
InteGreat
Hands-on investigation of Riemann sums becomes possible without intensive arithmetic gymnastics with this interactive lesson plan. Learners manipulate online graphing tools to develop and test theories about right, left, and...
Curated OER
Bouncing Ball : Function Families
A bouncing ball serves as more than entertainment when learning to apply quadratic functions to real-world events. This is the second of a two-part lesson, which can also be accessed from the website. The instructions say to measure the...
American Statistical Association
Scatter It! (Predict Billy’s Height)
How do doctors predict a child's future height? Scholars use one case study to determine the height of a child two years into the future. They graph the given data, determine the line of best fit, and use that to estimate the height in...
Virginia Department of Education
Transformationally Speaking
Young mathematicians explore transformations of graphs by graphing sets of functions on the same pair of axes. They use their graphs to determine the effect that the values of a and b in y = ax + b have on the graph of y = x.
Curated OER
Interval Notation
In this interval notation worksheet, students solve inequalities, sketch a graph of the answer, and write the answer using interval notation. This one-page worksheet contains 8 problems, with answers.
Curated OER
Graphing Solutions To Inequalities On A Number Line
Eighth graders graph solutions to problems on a number line. After discussing algebraic expressions, 8th graders discuss how to solve them using an inequality. They observe examples and then work problems at their desks and on the...
Curated OER
Graphing Absolute value Inequalities
High schoolers investigate the concept of inequalities and practice graphing them at various degrees of difficulty. They review the basic rules with the teacher at the level of theory which may make it harder for them to understand...
Curated OER
Inequalities - Absolute Value
Learners graph the absolute value of compound inequalities. Through a demonstration, students discover the meaning of absolute value. They take notes, rewrite opposites, and solve for each variable. Learners complete a worksheet and...
Curated OER
Lesson Plan 3: Inequalities
Ninth graders study inequalities. After a teacher demonstration, classmates solve and graph inequality problems. In groups, they are assigned specific tasks that lead to the solving of inequality word problems.
Curated OER
Linear Inequalities
Ninth graders graph linear inequalities. In this Algebra I lesson, 9th graders examine the graph of a linear inequality and in a game format, test coordinates to determine the region of the graph that satisfies the inequality.
Curated OER
Unit 5 Lesson 01: Graphing on a Number Line
Math masters are introduced to graphing inequalities on a number line. After reviewing inequality symbols, they practice representing them on a worksheet. This simple lesson serves its purpose.
Curated OER
Lesson Plan 2: Linear Inequalities
Students investigate linear inequalities and the associated symbols. After a teacher demonstration, they translate given phrases into symbols. Students solve and graph solutions to linear inequalities. Using newspapers, they locate...
Curated OER
Graphing Data
First graders explore the concept of graphing. In this data lesson, 1st graders gather information from a class survey and display their findings on a picture graph. Students also practice solving problems that their instructor models.
Curated OER
Exploring Graphs of Inequalities
Learn how to solve inequalities and graph their answers. Students use addition, subtraction, multiplication and division to solve problems. They analyze their graph using the TI calculator.
Curated OER
Systems of Linear Inequalities 2
Students solve systems of inequalities. In this lesson plan, they identify the solution of the two lines and shade the solution. They identify the boundary line and the region representing the solution.
Curated OER
Graph Logarithms
Mathematicians graph logarithmic equations. Teach your students how to identify the intercepts of logarithmic equations and tell whether the function is increasing or decreasing. They find the domain and range of each function.


