Curated OER
Graphing Linear Inequalities
In this Algebra I/Algebra II worksheet, learners graph two variable linear inequalities. The one page worksheet contains six problems. Answers are included.
Curated OER
Quadratic Inequalities
In this quadratic inequalities worksheet, 9th graders solve and graph 10 different problems that include various forms of inequalities. First, they solve each equation shown algebraically. Then, students state the solution set of the...
Curated OER
Absolute Value Inequalities
In this absolute value inequalities worksheet, students solve given inequalities and graph their solution. This four-page worksheet contains 26 problems. Answers are provided on the last two pages.
Curated OER
Solving Two-Step Inequalities
In this inequalities worksheet, learners use two steps to solve 16 inequality problems. A line graph is provided to graph the answers, and an answer key is provided.
Curated OER
Graph Linear Inequalities
In this algebra worksheet, students solve linear inequalities and graph their results on a coordinate plane. They shade the correct side of the line. There are 8 questions with an answer key.
Curated OER
Solving Multi-Step Inequalities
In this inequalities worksheet, students solve inequalities. They graph solutions on a number line. Students solve problems by combining like terms, and using the distributive property. Variables appear on both sides of the...
Curated OER
Linear Inequalities
In this Algebra I/Algebra II activity, students graph two variable linear inequalities. The one page activity contains six problems. Answers are included.
Curated OER
Inequalities and Measures of Central Tendency
In this inequality and measures of central tendency worksheet, students solve and graph linear inequalities. They organize given data to identify the mean, mode and range. Students interpret box-and-whisker plots. This three-page...
Curated OER
Cosmic Bar Graphs
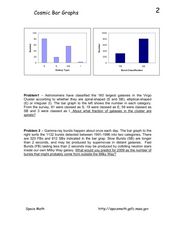
In this cosmic bar graph worksheet, students solve 2 problems using given bar graphs that plot the number of galaxies vs. the galaxy type and the number of gamma-ray bursts vs. the burst classification. Students find the fraction of...
University of California
Student Workbook: Algebra and Functions
A smorgasbord of functions, this packet has the basics required for your learners to be successful in the land of early algebra. The packet includes solving equations, graphing, evaluating, simplifying and basically everything else in...
Curated OER
Linear Inequalities
In this linear inequalities worksheet, students graph and shade 6 linear inequalities. Students then graph and shade 3 absolute value inequalities.
Curated OER
Equations and Inequalities
In this equations and inequalities learning exercise, 9th graders solve and graph 8 different problems that include various systems of equations. First, they determine the solution to each set of system of equations. Then, students graph...
Curated OER
Graph It!
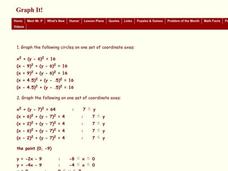
In this graph it worksheet, students graph inequalities on a coordinate plane. This one-page worksheet contains 3 problems.
Curated OER
Graphs to Represent a Data Set
Here are the number of animals Jackson saw at the zoo; scholars organize data into bar graphs using this worksheet. Encourage labeling, but consider having scholars do these on another sheet because there isn't room for the x-axis to be...
Curated OER
Linear Inequalities in Two Variables
Use this worksheet as a warm up, a refresher exercise, or a practice after a more detailed lesson on graphing linear inequalities in two variables. Start with boundaries that are horizontal or vertical, then move into graphs with...
Curated OER
Solving Linear Systems by Graphing
A worksheet that offers four problems to practice solving simultaneous equations by graphing. Equations are presented in slope-intercept form or standard form. Problems include two with unique solutions, one with no solution, and one...
Curated OER
Make a Different Graph
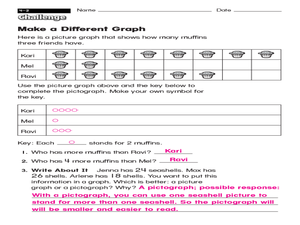
What is the difference between a picture graph and a pictograph? Young learners are given a picture graph detailing how many muffins three friends have, and they must complete a pictograph using a symbol of their choice. An answer key is...
Curated OER
Inequalities
In this inequalities instructional activity, students solve and complete 21 various types of problems. First, they graph the intersection of each graph shown. Then, students graph the union of each graph. In addition, they write the...
Curated OER
Inequalities in Two Variables
In this inequality instructional activity, students solve inequalities with two-variables. They solve systems of equations. Students graph inequality problems on a coordinate plane. This four-page instructional activity contains 36...
Math Mammoth
Compound Inequalities Involving 'And'
For this compound inequalities activity, middle schoolers solve and then graph the solution set for 12 compound inequalities with the word 'and'.
Inside Mathematics
Population
Population density, it is not all that it is plotted to be. Pupils analyze a scatter plot of population versus area for some of the states in the US. The class members respond to eight questions about the graph, specific points and...
EngageNY
Multi-Step Problems in the Real World
Connect graphs, equations, and tables for real-world problems. Young mathematicians analyze relationships to identify independent and dependent variables. These identifications help create tables and graphs for each situation.
Los Angeles County Office of Education
Assessment For The California Mathematics Standards Grade 4
Have scholars show what they know with a 20-page assessment aligned to the California State Standards. The test covers concepts such as large and whole numbers, all four mathematical operations, fractions, decimals, geometric figures,...
Concord Consortium
Intersections I
One, two, or zero solutions—quadratic systems have a variety of solution possibilities. Using the parent function and the standard form of the function, learners describe the values of a, b, and c that produce each solution type. They...


