Achieve
Stairway
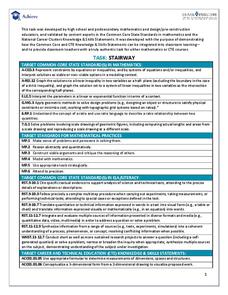
It's the stairway to learning! Scholars research all aspects of building a staircase. Using information from building codes, they write and graph a system of inequalities to analyze the constraints. The completed project is a scale model...
Inside Mathematics
Coffee
There are many ways to correlate coffee to life, but in this case a worksheet looks at the price of two different sizes of coffee. It requires interpreting a graph with two unknown variables, in this case the price, and solving for...
Illustrative Mathematics
Sports Equipment Set
Many students like to play sports and the equipment that goes with it costs money. The resource sets up an inequality that gives a total amount needed to purchase the equipment and the initial amount of money already obtained. In order...
Curated OER
Less and More Scavenger Hunt
Send your scholars on a measuring scavenger hunt with this interactive worksheet! They use a graphic organizer to record their findings as they search for items which are less than, more than, or just about one inch long. For each, they...
EngageNY
Modeling a Context from a Verbal Description (part 1)
When complicated algebraic expressions are involved, it is sometimes easier to use a table or graph to model a context. The exercises in this lesson are designed for business applications and require complex algebraic...
Curated OER
Narrow Corridor
Buying a new sofa? Learn how to use the Pythagorean Theorem, as well as algebra and graphing techniques, to determine whether the sofa will fit around a corner (which I'm sure you'll agree is a very important consideration!).
Concord Consortium
Betweenness V
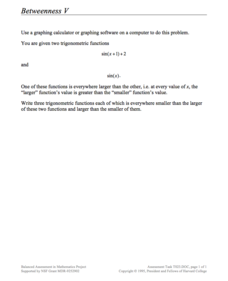
Take a unique approach to study the graphing of trigonometric functions. Young scholars consider two sine functions and write three functions that will lie between the two given. They use a graphing utility to assist in their explorations.
Concord Consortium
Rising Prices
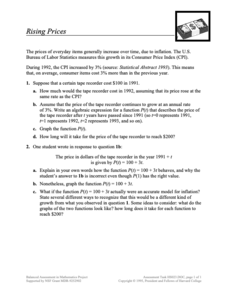
What will that cost in the future? The scenario provides pupils with a growth as a Consumer Price Index. Learners create functions for a given item to determine future prices and graph them. Class members then compare their functions to...
Concord Consortium
Betweenness II
Read between the curves ... quadratic curves! Young scholars analyze the graphs of two quadratic functions by writing their own function whose outputs are between the two given. They then consider intersecting quadratic functions and...
MCAS Mentor
Number Sense and Operations
In this number sense and operations worksheet, learners solve 15 different types of problems that include reading number lines and solving inequalities. First, they write the scientific notation of various numbers given. Then, pupils...
Curated OER
Birds' Eggs
More than just data, scatter plots are full of information that can be used to answer a variety of questions. This lesson uses a plot with information about bird egg sizes to answer questions about the relationship between length and...
Mathematics Assessment Project
Functions
Studying function means more than simply learning a formula. Learners must use functions to think through four problems and find solutions. Each task utilizes a different concept from a study of functions. Class members might...
Curated OER
Graphing Linear Inequalities
In this graphing worksheet, students solve and graph linear inequalities on a coordinate plane. Inequalities contain one variable. The solution set is sketched and colored. This worksheet contains eight problems on two pages, with an...
Curated OER
Solve and Graph Compound Inequalities
In this algebra worksheet, students solve inequalities and graph it on a number line. They use correct graphing method when dealing greater than and less than. There are 3 questions with an answer key.
Curated OER
Worksheet 2.4 Introduction to Inequalities
For this math worksheet, students read the examples that focus upon the concept of inequalities. The examples include the graph of the line.
Curated OER
Write the inequalities for each graph
In this algebra activity, students are given graphs of inequalities and asked to write the equation for each graph. There are 5 questions with an answer key.
Curated OER
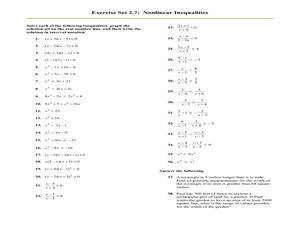
Nonlinear Inequalities
In this Algebra II worksheet, 11th graders solve nonlinear inequalities, graph the solution set on the number line, and write the solution in interval notation. The one page worksheet contains thirty-eight problems. Answers...
Curated OER
Algebra 2 Test
In this algebra worksheet, students solve problems by graphing inequalities, finding the slope of a line and identifying functions. This is a review of chapter 2 on an algebra test. There are 21 questions.
Curated OER
Graph the Absolute Value
In this graphing worksheet, students must graph the solution set to five absolute value functions on a number line. There is an answer sheet included.
Illustrative Mathematics
Peaches and Plums
According to the resource graph, which costs more: peaches or plums? Algebra learners compare two proportional relationships and then throw in a banana. Leaving out the scale helps learners become intuitive about graphing.
Los Angeles County Office of Education
Assessment for the California Mathematics Standards Grade 2
Test scholars mathematic skills with an assessment addressing addition, subtraction, multiplication, place value, measurement, geometric shapes, expanded notation; and their ability to compare numbers, write number...
West Contra Costa Unified School District
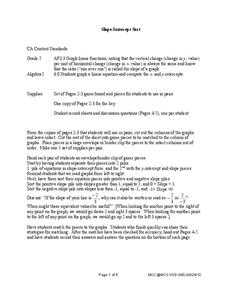
Slope-Intercept Sort
What's so special about slope? Pupils first match cards with slope and y-intercept to graphs of linear equations. They continue the lesson by matching equations in slope-intercept form to the same graphs.
Curated OER
Review for the Final Exam - College Prep Algebra
In this algebra review worksheet, students solve 100 open-ended and multiple choice problems. Students factor, simplify, graph, and solve inequalities, expressions, and equations.
West Contra Costa Unified School District
Correlation and Line of Best Fit
Computers are useful for more than just surfing the Internet. Pupils first investigate scatter plots and estimate correlation coefficients. Next, they use Microsoft Excel to create scatter plots and determine correlation...


