Curated OER
Multiplication Grids- Find the Factors
In this multiplication grid worksheet, 2nd graders fill in 6 grids by determining the factors to be places in the first column and the top row to make each equation true.
Curated OER
Multiplication Level 1 Grid
For this multiplication worksheet, students will use a grid to solve eight multiplication problems where the factors are four, five, six, and seven.
Curated OER
Enter the Names of the Playing Cards Into the Grid
In this crossword worksheet, students place the names of eight playing cards into the grid as in a crossword puzzle. The solution is provided.
Curated OER
Horizontal Bar Graph-- Blank Grid
For this math worksheet, students use the blank horizontal bar graph to record and display any data and to learn the correct way to generate a bar graph. Spaces are marked for students to write in the title and labels; intervals of 1-10...
Curated OER
Games, Grids, and Graphs
For this math worksheet, students look for the relationships between ordered pairs. They find the missing values and plot them on the x and y axis.
Inside Mathematics
Functions
A function is like a machine that has an input and an output. Challenge scholars to look at the eight given points and determine the two functions that would fit four of the points each — one is linear and the other non-linear. The...
EngageNY
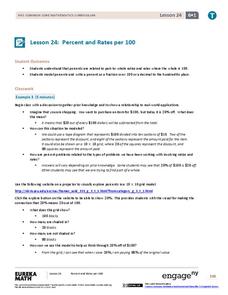
Percent and Rates per 100
What percentage of your class understands percents? Pupils learn the meaning of percents based upon rates per 100 in the 24th lesson plan in a series of 29. They represent percents as fractions, decimals, ratios, and models. The scholars...
Math Drills
Christmas Cartesian Art Tree
Spruce up graphing practice with an activity that has young mathematicians plot points on a coordinate plane, and then connect the points to create a Christmas tree.
EngageNY
Computing Actual Lengths from a Scale Drawing
The original drawing is eight units — how big is the scale drawing? Classmates determine the scale percent between a scale drawing and an object to calculate the length of a portion of the object. They use the percent equation to find...
EngageNY
An Exercise in Creating a Scale Drawing
Design your dream classroom. The lesson plan contains an exercise to have teams create a scale drawing of their dream classroom. Pairs take the measurements of their classroom and furniture and create a scale factor for them. To finish...
Curated OER
Graph Picture (Coordinate Pairs)
Coordinate graphing on a grid is the focus of this learning exercise. Young mathematicians plot 42 coordinate pairs on a graphing grid, then connect the dots to make a picture. A fun way to get your learners involved in graphing!
Curated OER
Linear Equations
Eighth and ninth graders solve and graph 42 different problems that include writing various equations and graphing them on a grid. First, they create a table for each equation and graph it on a grid locating the x-and y-intercepts. Then,...
Curated OER
Easter Graphing Fun
Graphing can be festive! This Easter instructional activity has scholars using coordinates to record the location of ten holiday images. The first is done for them, and the grid is large and appealing to younger learners. Consider...
Corbett Maths
Enlargements Using Ray Method
Figure out what to do when there is no grid to count. Using a ruler and a sharp pencil, the narrator shows how to perform a dilation when the figure is not on a grid. The ray method works by drawing a ray from the center of dilation...
EngageNY
Mid-Module Assessment Task: Grade 8 Module 3
How well does the class understand dilations? The three-part assessment presents problems related to the properties of dilations. Pupils perform dilations and determine whether a dilation is responsible for a specific image.
Noyce Foundation
Pizza Crusts
Enough stuffed crust to go around. Pupils calculate the area and perimeter of a variety of pizza shapes, including rectangular and circular. Individuals design rectangular pizzas with a given area to maximize the amount of crust and do...
EngageNY
Constant Rate
Two-variable equations can express a constant rate situation. The lesson presents several constant rate problems. Pupils use the stated constant rate to create a linear equation, find values in a table, and graph the points. The resource...
EngageNY
Introduction to Simultaneous Equations
Create an understanding of solving problems that require more than one equation. The lesson introduces the concept of systems of linear equations by using a familiar situation of constant rate problems. Pupils compare the graphs of...
EngageNY
Representations of a Line
Explore how to graph lines from different pieces of information. Scholars learn to graph linear functions when given an equation, given two points that satisfy the function, and when given the initial value and rate of change. They solve...
EngageNY
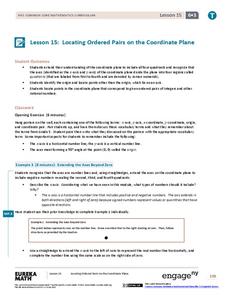
Locating Ordered Pairs on the Coordinate Plane
Four quadrants, four times the fun. Future mathematicians learn the terminology associated with the coordinate plane and how to plot points in all four quadrants. A worksheet tests their understanding of the material in the 16th...
EngageNY
Multi-Step Problems in the Real World
Connect graphs, equations, and tables for real-world problems. Young mathematicians analyze relationships to identify independent and dependent variables. These identifications help create tables and graphs for each situation.
Curated OER
Pumpkin Predictions
It's time for Halloween and math! Perfect for Fall, this simple worksheet provides a grid for young mathematicians to record their predictions about a pumpkin's height, stem length, diameter, circumference, and weight. After learners...
Curated OER
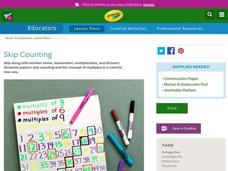
Skip Counting
Learners practice the skill of skip counting. In this early math lesson, students try counting at different rates, beinning at one and progressing to the number ten. Learners create a number grid with Crayola Crayons.
Curated OER
Halloween Point Plot
Practice graphing and plotting points with a festive Halloween flair! Scholars plot 21 points on a grid, connecting them to create a spooky shape!
Other popular searches
- Grid Math
- Holiday Math Grids
- Math Grid Puzzles
- Math Grid Art
- Math Grid Drawings
- Math Grids Decimal Models
- Math Grid Coordinates
- Math Grid Paper
- 48 Math Grid
- Diamond Math Grid
- Math Grid Drawings
- Thanksgiving Math Grid


