Noyce Foundation
Pizza Crusts
Enough stuffed crust to go around. Pupils calculate the area and perimeter of a variety of pizza shapes, including rectangular and circular. Individuals design rectangular pizzas with a given area to maximize the amount of crust and do...
EngageNY
Constant Rate
Two-variable equations can express a constant rate situation. The lesson presents several constant rate problems. Pupils use the stated constant rate to create a linear equation, find values in a table, and graph the points. The resource...
EngageNY
Introduction to Simultaneous Equations
Create an understanding of solving problems that require more than one equation. The lesson plan introduces the concept of systems of linear equations by using a familiar situation of constant rate problems. Pupils compare the graphs of...
EngageNY
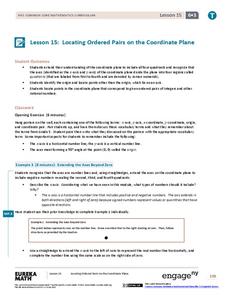
Locating Ordered Pairs on the Coordinate Plane
Four quadrants, four times the fun. Future mathematicians learn the terminology associated with the coordinate plane and how to plot points in all four quadrants. A worksheet tests their understanding of the material in the 16th...
EngageNY
Multi-Step Problems in the Real World
Connect graphs, equations, and tables for real-world problems. Young mathematicians analyze relationships to identify independent and dependent variables. These identifications help create tables and graphs for each situation.
Curated OER
Pumpkin Predictions
It's time for Halloween and math! Perfect for Fall, this simple worksheet provides a grid for young mathematicians to record their predictions about a pumpkin's height, stem length, diameter, circumference, and weight. After learners...
Curated OER
Halloween Point Plot
Practice graphing and plotting points with a festive Halloween flair! Scholars plot 21 points on a grid, connecting them to create a spooky shape!
Curated OER
Graphing Linear Equations
In this graphing linear equations instructional activity, students plot 22 lines on their coordinate grids. When directions are followed carefully, the result is a picture.
Curated OER
Clean up the Money!
For this money worksheet, students fill up a grid with coins and then roll dice to get ordered pairs and take the money of the ordered pair that they roll. Students then add up their money in the end and see who wins.
Common Core Sheets
Determining Coordinates: Reading Positive & Negative Coordinates
For kids who have a hard time with graphing, a grid with coordinates can look like an unsolvable puzzle. A series of worksheets uses symbols and shapes like hearts, stars, and letters to help kids find the correct coordinates.
Coloring Squared
Thanksgiving Turkey—Holiday Subtraction
It's time to practice 2-digit subtraction up to 20 the fun way. Learners solve a grid full of subtraction problems and then color each square the appropriate color according to the key. The final picture: a turkey!
Curriculum Corner
Spring Find a Fact Addition
Test scholars' knowledge of addition facts with a festive activity that makes adding a two-person game. Pairs examine a grid of numbers to locate and color addition facts. Last person to color three squares wins!
Corbett Maths
Enlargements with Negative Scale Factor
How will a scale factor affect a figure—negatively? Using a grid, the narrator of an engaging video performs a dilation with a negative scale factor. The presenter compares a positive scale factor with a negative scale factor to explain...
Mathed Up!
Cumulative Frequency and Box Plots
Learn how to display data. Young data analysts watch a video to review how to create cumulative frequency histograms and box plots. They work on a set of questions to practice producing these data displays.
Curated OER
Graph Paper
In this blank graph paper worksheet, students use the gridded sections marked off with the numbers 1-10 on the x and the y axis as directed by their teachers.
Curated OER
Rotations, Reflections, and Translations
In this transformations worksheet, students copy the given figures onto grid paper and complete the transformations. Kids then find the pictures that show translations, rotations, and reflections. Students finish with two test prep...
Curated OER
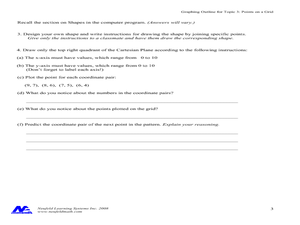
Concept: Points on a Grid
In this coordinate grid graphing worksheet, students play a game of Battleship on the computer. They answer 21 questions about the coordinate grid and graphing.
Curated OER
Use the Grid to Answer the Questions
For this algebra worksheet, students identify the points on a graph and make sure the lines satisfy the conditions placed on the values.
Curated OER
Math Regents Exam Questions - Pearson Integrated Algebra P.304: Histograms
For this histograms worksheet, students solve 9 short answer, multiple choice, and graphing problems. Students construct frequency tables and histograms of data.
Curated OER
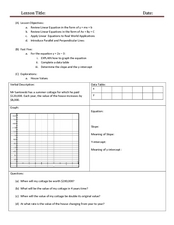
Review Linear Equations
Explore algebra I/algebra II with this series of worksheets. Pupils write linear equations in slope-intercept and standard form, graph linear equations, and apply linear equations to real world applications. The six-page worksheet...
Illustrative Mathematics
Latitude
The greater the latitude, the less of the Earth is north. Scholars graph the relationship between the latitude and the percentage of the Earth that is north of the latitude. Using the graph and the table, class members interpret values...
Sunday School Resources
Noah & the Ark
Support your study of Noah's Ark with these materials. Included here are word puzzles, coloring pages, math exercises, and more, all related to Noah's Ark.
Achieve
Fences
Pupils design a fence for a backyard pool. Scholars develop a fence design based on given constraints, determine the amount of material they need, and calculate the cost of the project.
Virginia Department of Education
Exponential Modeling
Investigate exponential growth and decay. A set of six activities has pupils collecting and researching data in a variety of situations involving exponential relationships. They model these situations with exponential functions and solve...
Other popular searches
- Holiday Math Grids
- Math Grids Decimal Models
- Math Grids Decimal
- Math Grids Activities
- Math Grids Worksheets


