Yummy Math
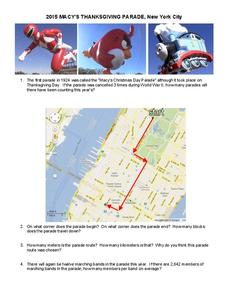
2015 Macy's Thanksgiving Parade
Take a seat on the parade route with a holiday-themed set of word problems. Young mathematicians answer questions based on the annual Macy's Thanksgiving Parade in New York City, including finding the average number of members in a...
Noyce Foundation
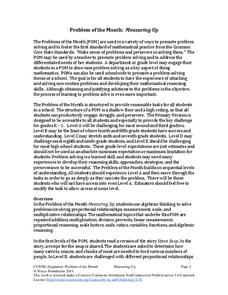
Measuring Up
Teach the basics of measurement and conversion with a five-lesson resource that builds an understanding of proportion and measurement conversion from elementary through high school. Initially, young scholars use ratios to determine soup...
Illustrative Mathematics
What's the Point?
Given a certain amount of points, how many line segments can you connect between them? How many close geometric figures can you create? These are the types of questions learners are asked to solve in a assessment-based worksheet.
National Council of Teachers of Mathematics
Eruptions: Old Faithful Geyser
How long do we have to wait? Given several days of times between eruptions of Old Faithful, learners create a graphical representation for two days. Groups combine their data to determine an appropriate wait time between eruptions.
Howard County Schools
Generous Aunt
Witness the power of exponential growth with an activity that investigates two different savings plans. Class members create tables of values to see how and when a savings plan increasing exponentially exceeds one increasing linearly.
Curated OER
Shape Sort
Sorting is a great way to familiarize learners with basic shapes in this partner activity. Pairs have sixteen shape cards with various sizes and types of triangles, rectangles, hexagons, and squares. They have four category cards in...
Curated OER
Representing Data 1: Using Frequency Graphs
Here is a lesson that focuses on the use of frequency graphs to identify a range of measures and makes sense of data in a real-world context as well as constructing frequency graphs given information about the mean, median, and range of...
Mathematics Assessment Project
Representing Polynomials
Use this complete and very detailed lesson plan to assess your students' understanding of two important behaviors of polynomials. The first is the relationship between the zeros of a polynomial function and the function's graph, and the...
Curated OER
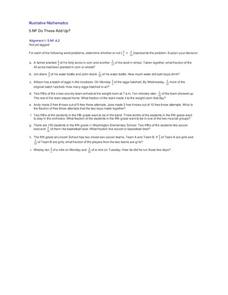
Do These Add Up?
Common Core mathematical practices require that young mathematicians not only know how to add fractions with unlike denominators, but also to recognize when adding fractions are appropriate for the word problem. Fifth graders are given...
Curated OER
Largest Hamburger Ever?
If a 150 lb. person can comfortably eat and digest a 1 lb. burger, then how large would the person be who can comfortably eat and digest a 350 lb. burger? For a burger that size, it would take either a large person or a class of really...
Illustrative Mathematics
Buying Protein Bars and Magazines
Packing for a trip? This activity allows learners to decide how many magazines and protein bars they can buy with twenty dollars. They can organize their work in a chart to track how many items they can purchase. There are two different...
Curated OER
Find 1
Extend your class's ability to represent unit fractions on a number line with this challenging worksheet. Given two number lines, one labeled with zero and 1/4, the other with zero and 5/3, learners must accurately locate the number one...
National Security Agency
Classifying Triangles
Building on young mathematicians' prior knowledge of three-sided shapes, this lesson series explores the defining characteristics of different types of triangles. Starting with a shared reading of the children's book The Greedy...
Achieve
Corn and Oats
How much land does a parcel hold? How much fertilizer does it take for a field of corn? Pupils answer these questions and more as they apply ratio reasoning and unit analysis.
California Mathematics Project
Model Solar System
The sun's diameter is 864,337 miles—challenge learners to create a scale model of the solar system that fits in your classroom. Scholars make conversions and work with scientific notation as they create the scale model.
Mathed Up!
Tree Diagrams
Explore how to visually represent probability problems. Scholars watch a video to refresh their memories on tree diagrams. To finish the activity, they complete a worksheet of questions on this topic.
Curated OER
Soaring Towers
How tall can your tower get? Implement shapes, building strategies, teamwork, and prediction in this interactive tower activity. Learners discuss past experiences with stacking materials, recalling ways they kept it from falling over....
Curated OER
Math Vocabulary Decoding Activity
In this math vocabulary learning exercise, students use a letter key code to match match vocabulary words to their definitions. A reference web site it given for additional activities.
Curated OER
Graphing Linear Equations Cards
OK, so maybe graphing linear equations can be fun. This activity includes a set of linear equation cards to be cut and place face up on a table. Learners pick a card and match it to the correct graph card. This is a really fun way to...
Curated OER
Mental Math: Use the Properties-Reteach
In this mental math reteach worksheet, students review the commutative, associative and distributive properties, then complete a set of 13 problems. A reference web site is given for additional activities.
Curated OER
Math Vocabulary Maze
In this math maze activity, learners navigate their way through a maze using clues and spelling out math vocabulary words. A reference web site is included for additional activities.
Curated OER
Math--Recognizing and Matching Numbers
In this recognizing and matching numbers worksheet, students draw a circle around the bunnies from each hutch and then draw a line from the bunnies to the hutches to show where they belong. Students fill in the missing numbers in 5...
Curated OER
Divisibility Checks: Paired Activity
In this division game instructional activity, students will work in small groups to play a game about dividing numbers. A teacher's guide with game instructions is included.
Curated OER
Money Math Challenge #2
In this money worksheet, students count the total amount of money represented by groups of coins, writing the amount on a line next to each group.


