EngageNY
More on Modeling Relationships with a Line
How do you create a residual plot? Work as a class and in small groups through the activity in order to learn how to build a residual plot. The activity builds upon previous learning on calculating residuals and serves as a...
EngageNY
Properties of Area
What properties does area possess? Solidify the area properties that pupils learned in previous years. Groups investigate the five properties using four problems, which then provide the basis for a class discussion.
EngageNY
The Scaling Principle for Area
As they investigate scaling figures and calculate the resulting areas, groups determine the area of similar figures. They continue to investigate the results when the vertical and horizontal scales are not equal.
EngageNY
General Pyramids and Cones and Their Cross-Sections
Are pyramids and cones similar in definition to prisms and cylinders? By examining the definitions, pupils determine that pyramids and cones are subsets of general cones. Working in groups, they continue to investigate the relationships...
EngageNY
Analyzing a Verbal Description
What function will describe the insect population growth? Pairs or small groups work together to determine which type of function and specific function will model given scenarios. The scenarios differentiate between linear,...
EngageNY
Ruling Out Chance (part 3)
Pupils analyze group data to identify significant differences. They use simulation to create their own random assignment data for comparison.
EngageNY
Piecewise Functions
Show your class members that if they can graph a linear function, they can graph an absolute value function. Groups create an absolute value graph using a table, then entertain the idea of an absolute value function defined as two...
EngageNY
Four Interesting Transformations of Functions (Part 2)
What happens to a function whose graph is translated horizontally? Groups find out as they investigate the effects of addition and subtraction within a function. This nineteenth lesson in a 26-part series focuses on horizontal...
EngageNY
Interpreting the Graph of a Function
Groups sort through NASA data provided in a graphic to create a graph using uniform units and intervals. Individuals then make connections to the increasing, decreasing, and constant intervals of the graph and relate these...
EngageNY
Discovering the Geometric Effect of Complex Multiplication
Does complex number multiplication have the class spinning? Here's a resource that helps pupils explore and discover the geometric effect of multiplying complex numbers. In the 14th installment in the 32-part unit groups look at the unit...
EngageNY
Exploiting the Connection to Trigonometry 1
Class members use the powers of multiplication in the 19th installment of the 32-part unit has individuals to utilize what they know about the multiplication of complex numbers to calculate the integral powers of a complex...
Virginia Department of Education
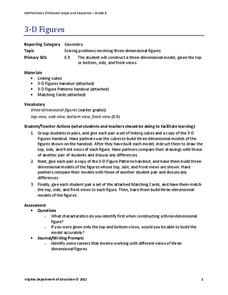
3-D Figures
Scholars construct three-dimensional figures to study dimension and side views. Learners build models using linking cubes to match views of different sides. After practicing with models, they attempt to match three-dimensional drawings...
Kenan Fellows
Weight and Balance of an Airplane
A career in aeronautics might be calling your class members. Building from the previous two lessons in the series, learners continue analyzing the mathematics of aeronautics. Groups create a paper airplane using paperclips for balance....
Curated OER
Pick A Number
Elementary schoolers find out which month has the most class birthdays (mode) and which birthday represents the middle point of all the birthdays (median). They gather and organize data to find one number that fairly represents the whole...
Curated OER
Indy 500
Start your engines! Small groups collect data from websites pertaining to the Indianapolis 500 in order to determine average speed per lap and miles in each lap. The lesson requires prior knowledge of the the formula d=rt.
National Council of Teachers of Mathematics
The Game of SKUNK
Do I stand or do I sit? The class plays a dice game where they must decide to either continue to stand and play or sit down and keep their points. After the game, groups discuss individuals' strategies and see connections to the...
Curated OER
Put Your Truss in Building Bridges
Students apply abstract concepts, such as stress, fulcrums, the law of gravity, and the strength of different geometric shapes. Groups of student contractors operate simulated architectural firms to create strong, economical bridges.
Curated OER
Tiling the Classroom
Students see how to identify regular polygons, how to slide, turn and flip polygons, and why certain polygons tessellate better than others. Groups create a one foot square design to be used to tile the classroom. Great instructional...
Curated OER
Boat Hull Design
Working in small groups young scholars develop three alternative boat designs. They discuss the rationale for the type of hull, propeller, location of ballast, and type of building material used in their design. They build their boat.
Curated OER
Division by Fractions (Part Two)
Investigate division through the use of array models. The lesson focuses on using area models to compare division as sharing with division as grouping. Young scholars evaluate the usefulness and limitations of the two array models.
Curated OER
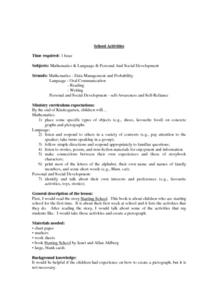
School Activities
First graders place some specific types of objects (e.g., shoes, favorite food) on concrete graphs and pictographs. They listen and respond to others in a variety of contexts (e.g., pay attention to the speaker; take turns speaking in a...
Curated OER
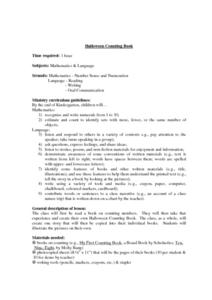
Halloween Counting Book
First graders recognize and write numerals from 1 to 10. They estimate and count to identify sets with more, fewer, or the same number of objects, listen and respond to others in a variety of contexts, and take turns speaking in a...
Curated OER
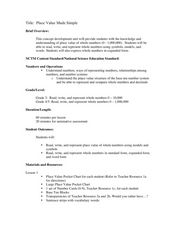
Place Value Made Simple
Elementary schoolers explore place value to the millions place. They construct and evaluate the value of numbers. Working in small groups, pupils problem solve with pocket place value charts, and examine standard and expanded forms. This...
Curated OER
Odd or Even
A great way to show the difference between odd and even numbers is by using blocks. The graphics in this PowerPoint do a great job at showing the two groups of numbers. Tip: After viewing this presentation, have students experiment with...
Other popular searches
- Grouping Math
- Math Grouping Numbers
- Math Grouping and Sorting
- Equal Grouping Math
- Math Brackets
- Math Grouping Tens
- Math Grouping Activity
- Math Grouping Worksheets
- Math Lessons Ncaa Brackets
- Grouping in Math


