Curated OER
Plotting Temperature and Altitude
students convert the temperature readings from degrees Celsius to degrees Fahrenheit. they predict and create a graph of what the graph of altitude (x-axis) versus temperature in degrees Fahrenheit (y-axis) might look like.
Curated OER
Making Patterns - Create, Analyze, and Predict
Fourth graders practice making patterns using Unifix cubes and identify, analyze, and determine rules for describing numerical patterns involving operations and nonnumerical growing patterns. They also find an example of a pattern in...
Texas Instruments
The Leaning Tower of Pisa
Learners estimate the equation of a line, angle of elevation and depression in this math lesson. They analyze e famous landmark design and make connections to algebra and geometry. They will also generate an equation, model the x and y...
Curated OER
Inequalities and Triangles
Students prove and apply theorems of triangle inequality and hinge theorem. For this geometry lesson, students will discuss which triangle is bigger and why. They will use theorems, such as Exterior Angle Inequality or the Pythagorean...
Curated OER
Shaping Up with Nature at Black Bayou Lake
Young scholars visit a local lake refuge and identify shapes they find in nature. They take pictures of the various shapes and use KidPix to draw shapes around the shapes in the pictures. They watch a slideshow of all the shapes found by...
Curated OER
Geometry: Helix-a-Graph
Learners use geometry to create art. For this geometric graphing and patterns lesson, students create a helix-a-graph by plotting points on a grid that follow a certain pattern and analyze the drawing they created.
Curated OER
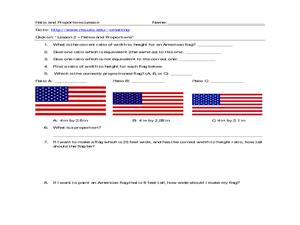
The American Flag-Basic Ratios and Proportions
Students solve problems with ratios and proportions. In this algebra lesson,students apply the concept of ratios and proportions to the real world.
Curated OER
Using Mathematics to Explain the Spread of Diseases
Students use statistics to solve problems based on the spread of disease. In this disease lesson students study the role that viruses and bacteria play in the spread of diseases and explain pandemics.
Curated OER
Party Time
Students engage in a lesson about finding information from the grocery store to put into data that can be measured. The data is found in advertisements and food labels. They plan the cost of a party when using the unit cost of various...
Curated OER
Multiply Polynomials
Students solve polynomial problems. In this algebra lesson, students multiply polynomial equations using FOIL and quadratic formula. They complete the square and factor by grouping.
Curated OER
Tangram Puzzles
Students explore the origin of tangram. In this algebra instructional activity, students form different shapes and figures using tangram. They solve for the area of different shapes without using any geometric formulas, but the idea of...
Curated OER
Understanding Fractions
Learners explore the parts of an orange to develop an understanding of the addition and subtraction of fractions. The concept of representing parts of a whole by dividing an object into smaller pieces is experienced in this hands-on...
Curated OER
My Time Book
First graders write a time book. In this writing and telling time lesson, 1st graders learn about the concept of time using a Judy clock. Students read a book about a ladybug and look closely at the time on the clock. Students then...
Curated OER
Three Digit Addition
In this math learning exercise, students solve three digit addition problems. Some of the addition problems require regrouping. The problems are set up to solve vertically.
Helping with Math
Angles: Supplementary, Corresponding & Alternate (2 of 2)
In the second of two similar worksheets, anglers compute missing angles when given an alternate, supplementary, or complementary value. There are six problems to solve, but each of them requires two to four solutions. This is a nice...
Helping with Math
Angles: Supplementary, Corresponding & Alternate (1 of 2)
In the first of two similar worksheets, geometers compute two to four unknown angles when given an alternate, supplementary, or complementary value. There are six multliple-step problems to solve. This is a nice challenge for your...
Curated OER
Geometry: Calculating Volumes
In this volume worksheet, students find the volume of 6 prisms/cylinders. Students use a picture and given measurements of the prisms/cylinders to find the volume.
Alabama Learning Exchange
The Mean, Median, and Mode Chain Gang
Students analyze a set of data. They work in cooperative groups and use chain links to identify the mean, median, and mode of the chain.
Curated OER
Tantalizing Tangrams
Students explore "area." In this tangram geometry and measurement instructional activity, students arrange tangram pieces to find the area of characters presented in a story they listen to on a website. Website information...
Curated OER
Water Treatment Plant Tour
Students define vocabulary related to geometry and calculate the volume. In this geometry lesson, students calculate flow rates, and volume as it relates to a water plant facility. They calculate the volume of three dimensional shapes...
Curated OER
Not Everything is More Expensive
Students compare prices and determine percent increases and decreases of items in order to make wise purchases. In this percent increases and decreases lesson plan, students calculate the amounts based on grocery store ads.
Curated OER
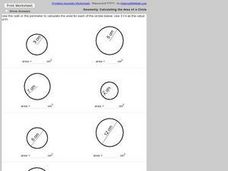
Geometry: Calculating the Area of a Circle
In this area worksheet, students use the perimeter or radius to determine the area of a circle. This one-page worksheet contains 8 problems. This worksheet may be produced in printed form. Answers may be viewed on-line.
Curated OER
Indirect Measurement
Young scholars measure and apply their knowledge of proportion to solve problems. For this geometry lesson, students measure using a meter stick, small mirror and measuring tape. They compare and contrast their measurements to objects...
Curated OER
Pumped Up Gas Prices
Students calculate gas prices. In this transportation lesson plan, students tally the mileage and gas costs of their car for one months. They figure out how much was spent on gas and create a graph showing average gas prices over...


