Curated OER
What is my Angle? App
Learners estimate angle measures in this this estimating angle measures lesson. They use an application on their graphing calculator that shows various settings involving angles and then they estimate the angle measure of a clock's...
Curated OER
Solving Equations with Solve It
Pupils solve equations using a TI in this algebra lesson plan. They will practice solving equations and systems of equations on a TI. The TI-Navigator is required for this assignment.
Curated OER
Going...going...gone? Tropical Rainforests-How They Work, What They Do for Us, What's Being Done to Them...
Sixth graders explore the Tropical Rainforest and come to understand what it is and how it affects the ecosystem. In this rainforests lesson, 6th graders write about the Tropical Rainforest, imagine they are in the Tropical Rainforest,...
Curated OER
Starfish: The Stars of the Sea Lesson Plan
Students discover many characteristics of the starfish. In this early childhood lesson plan, students identify characteristics of starfish. Students develop a language experience chart and record their new-found information, and...
Curated OER
Bubble Festival
Young scholars practice scientific inquiry while learning about bubbles. In this lesson about bubbles, students explore characteristics of bubbles. Young scholars move through nine different "bubble" stations following directions and...
Curated OER
Comparing Densities of Different Liquids
Students experiment with a variety of liquids to calculate density. For this integrated science and math lesson, students listen to a story in which the characters must prove and explain why 5 "mystery" liquids react in a certain manner....
Curated OER
Touch and Discover
Students identify the physical properties of items using the sense of touch. In this touch and discover lesson, students describe items. Students sort items using a Venn diagram.
Curated OER
Border Patrol ID: 11603
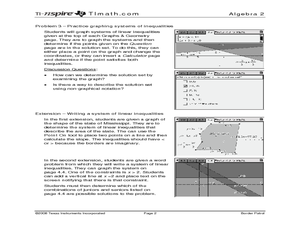
Incorporate technology in your classroom by teaching your students how to graph systems of linear inequalities as they apply to an area of land. The lesson provides an extension in which students are challenged to write a system of...
Texas Instruments
Buying Your First New Car!
Learners explore exponential growth and decay using M&M’s in this Algebra II/Pre-calculus lesson. They investigate the cost of a new car by calculating depreciation and payments.
Curated OER
Discriminating Against the Zero
Students explore the concept of quadratic equations. In this quadratic equations lesson, students find the roots or zeros of quadratic equations using the quadratic formula. Students give examples of functions with 2 real, rational...
Curated OER
Paper Dart Airplane
Students create a paper dart airplane and measure its flight pattern. In this flight lesson, students follow the included directions to build their own paper airplane. The students change the aileron configurations to see how it affects...
Curated OER
Principles of Flight: Bernoulli's Lift
Students discover how air pressure effects flight. In this physics lesson, students create two types of airplane wings so they can observe the way air pressure creates lift. Students utilize a printout to create the airplane wings.
Curated OER
How Trees Contribute to the Water Cycle
In this water cycle instructional activity, 3rd graders conduct an experiment where they observe and calculate how water transpires in different types of trees. Students engage in a class discussion and use Venn Diagrams to compare...
Curated OER
Fun With Adhesives
Students observe, measure, and record the properties in making objects stick together using science tools. In this science lesson, students explore with their senses while mixing flour and water. Additionally, students share their...
Curated OER
Basic Limits
Learners calculate the limits of functions. In this calculus instructional activity, high schoolers find the left and right handed limits of different functions. They use the Ti Navigator to drag the function around as they study limits.
Curated OER
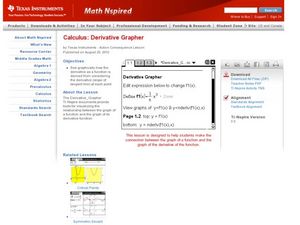
Derivative Grapher
Learners graph the derivative of functions in this calculus lesson. They use the TI to graph their functions and algebraically take the derivative of each function. They then create a visual and analyze the graph.
Curated OER
Calculus Inverse Derivative
Students solve equations using a given derivative. In this calculus lesson, students identify the rise of fall of each function. They use the calculator to find the derivative.
Texas Instruments
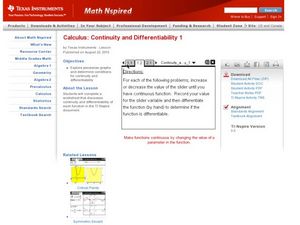
Continuity and Differentiability 1
Pupils examine graphs for continuity and differentiability in this calculus lesson. They observe piecewise functions to see where continuity and differentiability come into play. Learners finish by graphing their equation on the TI...
Texas Instruments
Mean Value Theorem
Students calculate the slopes of secant lines. For this calculus lesson, students graph tangent and secant lines using the coordinate plane. They use the Ti calculator to graph and observe the lines.
Curated OER
Concavity of a Graph
Learners explore the graph of a function. In this calculus lesson, students identify when and where the graph is increasing or decreasing. They identify if it concave up or down by moving the cursor.
Curated OER
Newton's Method
Student approximate the roots of E using Newtons Method. In this calculus lesson, high schoolers calculate the equation of tangent a line. They use the TI to visualize the tangent line.
Texas Instruments
Minimums, Maximums and Zeroes
Young mathematicians will identify the minimum, maximum-and zeros of a function in this calculus lesson. They relate the derivative of a function to its zeros and minimum or maximum. They then graph their solutions and explain different...
Curated OER
Derivative Analysis
Young scholars analyze the derivative of a graph. In this calculus lesson, students identify the different behavior of a graph. They label concavity of the graphs as increasing or decreasing.
Texas Instruments
Integration By Parts
Pupils solve problems using integration by parts in this calculus lesson. Learners apply the product rule and integration by parts. They graph the equation and use the TI to observe the integration process.


