Curated OER
Sign of the Derivative
Learn how to investigate the change in a graph by dragging the cursor to observe the change in the function. They use the TI calculator to graph their parabola.
Curated OER
Filling The Urn
Learners calculate the area under a curve. In this calculus instructional activity,students calculate the area by integrating the equation. They calculate the volume of cylindrical shapes created between graphs.
Curated OER
Integration By Substitution
Young scholars calculate the solution using integrals in this calculus lesson. They use the TI to create a visual of how to compute integrals. Learners also use substitution by integration and all its properties.
Curated OER
Definite Integral
Learners investigate the intervals represented by a function in this calculus lesson. They decide what interval of the function will be positive, negative or zero. They are then given graphs of functions and asked to analyze it.
Curated OER
Limit of a Sequence
Young scholars solve problems using limits in this calculus lesson. They calculate the solution to a problem by substituting in positive integers and relate the sequence output as it relates to the limit of a function.
Curated OER
Sequences
Students solve problems using the TI. In this calculus lesson plan, students evaluate functions using sequences. They graph the functions on the TI and make observations.
Texas Instruments
Convergence of Taylor Series
Young scholars analyze taylor series for convergence. In this calculus lesson, students analyze the graph of a taylor series as it relates to functions. They use the TI calculator to graph and observe the different series.
Curated OER
Polar Graphs
Students graph polar graphs. In this calculus lesson, students convert between polar and rectangular coordinates. They graph their solution on the TI calculator and make observations.
Curated OER
Dog Days or Dog Years?
In need of some algebraic fun with real world implications?Learners use ordered pairs, a table of values and a scatter plot to evaluate the validity of several real world data sets. The class focuses on dog ages in human years, domain,...
Curated OER
Let's Make a Meal: A Study of Oats
Learners investigate the history and health benefits of oats. For this food history and nutrition lesson, students describe the origin of oats in America, define nutrition related vocabulary, and read and follow recipes for making...
Curated OER
Learning about Infectious Diseases
All of the activities and worksheets in this unit relate to learning about how infectious diseases spread & how the body deals with them. There is a collection of problem-based learning activities, as well very useful at-home...
Curated OER
How Do Car Engines Work?
Students perform an experiment which simulates what happens inside an internal combustion engine. They explain how the chemical reaction they witnessed is similar to what happens inside the car engine.
Curated OER
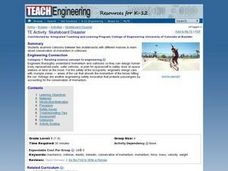
Skateboard Disaster
Students conduct a hands-on experiment with collisions between two skateboards of different masses. They are introduced to the concept of conservation of momentum in collisions and consider how their observations might help engineers...
Curated OER
Sliders - Static and Kinetic Friction
Middle schoolers work in groups to conduct experiments the demonstrate the differences between static and kinetic friction. They consider how friction affects us in our everyday lives, determine the effects of weight on friction and...
Curated OER
Wind Energy
Students explore wind energy by making a pinwheel to model a wind turbine. They experiment with their turbine by placing it in different locations for optimal energy.
Curated OER
TE Lesson: I've Got Issues!
Students study environmental issues from different perspectives. They look at the issues from the view of both preservationists and conservationists as they identify themselves with one group or the other. They determine how teamwork...
Curated OER
Cleaning Air with Balloons
Students examine how a pollutant recovery method functions in cleaning industrial air pollution. They listen to a teacher-led discussion, conduct an experiment with balloons, static electricity, and pepper, and observe and record the...
Curated OER
Kidney Filtering
Students investigate how kidneys function. They discuss how a dialysis machine works, and conduct an experiment in which they filter different substances through a plastic window screen, various sizes of hardware cloth, and poultry...
Curated OER
Two-Cell Battery
Students build their own two-cell battery and determine which electrolyte solution is best suited for making a battery. They discuss background information for their experiment, construct and test their battery, and using the chart on...
Curated OER
Statistical Process Control
Students brainstorm items they have that use memory and view Statistical Process Control PowerPoint presentation. They complete Statistical Process Control Simulation/experiment then find the average, range and standard deviation in...
Curated OER
When the Snow is as High as an Elephant
High schoolers study the concept of mean values using a data plot. Learners enter the given data in the activity to create their data table. They use the data table to calculate the mean of the snowfall percentage provided in the...
Texas Instruments
Data Collection for Bar Graphs
Learners study the concept of central tendency in this data collection for bar graph lesson. They collect data outside as instructed and organize it into a bar graphs, then they list in specific groups the labels that appear on the...
Curated OER
Augmented Matrices
Pupils write systems of equations in an augmented matrix and enter it into their calculator. They use the reduced row echelon function on the calculator to solve the system of equations.
Curated OER
Chill Out: How Hot Objects Cool
Teach how to explore exponential equations. In this Algebra II lesson, learners investigate the graph that occurs as a hot liquid cools. Students model the data algebraically.


