Curated OER
Graph the Results: Applesauce Taste Test
Students work together to make applesauce following specific directions. They taste each applesauce and graph the results based on the taste test. They also use the internet to create an online graph.
Curated OER
Food Color Chemistry
Students investigate plant pigments in fruits and vegetables. In this plant pigments lesson plan, students observe the effects of pH changes on chlorophyll in one demonstration and they observe the effects pH changes on flavonoids in...
Curated OER
Major Organic Acids in Fruits
Students investigate the organic acids present in a variety of juices. In this organic acids lesson plan, students read about the effects of organic acids in juices. They use paper chromatography to separate out the acids present in a...
Illustrative Mathematics
Video Streaming
Your movie fans will be interested in this resource. They will compare video streaming plans. One plan charges a set rate per month and a reduced viewing fee, and the other has a flat rate per each video viewed. Unfortunately, learners...
Curated OER
The Big Apple
This lesson has various activities that can be done simultaneously in groups or one at a time with the entire class. The activities center around New York and apples.
Curated OER
Measuring Up with Apples
Second graders estimate and measure various classroom objects using an apple as their tool for measuring, and record their measurement results on a data worksheet.
Curated OER
Learning Inference
Making inferences can be a tricky proposition for middle schoolers. In the lesson presented here, pupils practice the skill of drawing a conclusion and making a judgment - which are what making an inference is all about! There are five...
Curated OER
Estimation
Students estimate the cost of individual items found on a typical grocery list. They participte in a teacher-led demonstration, solve word problems, and estimate the cost of ten items placed into their group's grocery basket.
Curated OER
TI-Nspire Activity: What Does Your Representation Tell You?
By learning to select the best representation for three meal plans, students compare three meal plans to determine the best choice. Data for the meal plans is sorted on a table, as an algebraic equation, and graphed on a coordinate grid....
Curated OER
Where Should They Hold the Fundraising Party?
Pupils explore financial applications of linear functions. As they investigate the steps necessary to plan a fundraising event, learners explore minimizing cost and maximizing profits.
Curated OER
M & M Counting Chart
Students create an individual M&M's graph based on the number of each color of candy pieces in their handful of candy. They graph the favorite color of the whole class while practicing counting and color identification.
Curated OER
Estimate Amount
In this estimating the total amount worksheet, learners observe a page of apples in groups of two and estimate whether there are twenty-five or eighty apples. Students choose one multiple choice answer.
SurfScore
Kodable
Prepare young scholars for life in the twenty-first century with this introduction to computer coding formatted as a fun problem solving game, this resource is a great way to develop children's sequential thinking skills.
Philadelphia Museum of Art
Physics at the Art Museum: Kinetic Energy, Potential Energy, and Work
Connect science, math, and art for a true interdisciplinary lesson! Learners explore simple machines in art. Through analysis with a physics app, they identify positions of kinetic and potential energy and make conclusions about work.
Curated OER
Finding the Circumference and Area of a Circle
Sixth graders discover what circumference is. In this measurement lesson, 6th graders identify the radius and diameter of different circles. Students discover how to find the area of a circle using the radius and diameter.
Curated OER
Home Living / Daily Living: Shopping List 2
I've done this exercise with my special needs learners more times than I can count. They practice getting ready to shop at the grocery store by identifying items on their shopping list. They match grocery items to the proper department...
Curated OER
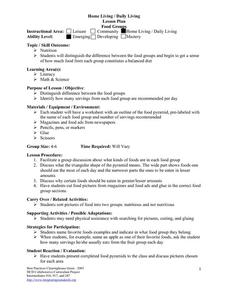
Home Living/ Daily Living: Food Groups
What are the best foods to eat, and how much is too much? Kids discuss the importance of eating the right amount of each of the four food groups. They discuss the food pyramid and make meals by cutting and pasting foods from a magazine...
Curated OER
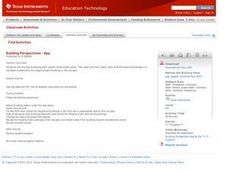
Building Perspectives App
Learners explore a perspective application of the TI-73. In this middle school mathematics lesson, students view the front, back, right, and left views of a city to determine the height of each building in a city plan.
Curated OER
Landfills: A Solid Waste Management Plan
Middle schoolers are able to list the types of household waste that they produce daily. They are able to describe some other types of waste that are produced by industry or agriculture to help maintain their lifestyles. Students are...
Curated OER
By the Pound, Gram Liter or Gallon
Students participate in experiments at five stations to practice measurement. In this measuring lesson, students are presented different produce and objects and must measure with an appropriate tool. Students use metric and customary...
Curated OER
Benny's Pennies
Students read Benny's Pennies and predict what Bennie will buy with each penny based on the illustrations. They locate rhyming words and make a chart of what Benny bought and also for what they would have bought.
Curated OER
Teddy Bear Picnic
Young scholars sit in a circle with their bears from home, each child introduces their bear, then students examine all the bears and think of one way that they can be sorted.
Curated OER
Comparing Fractions with Objects and Pictures
Scholars will compare fractions using objects and pictures. They view pre-made pictures and concrete objects of fractions. Then use small white boards to draw pictorial representations of fractions.
Curated OER
Seeds of Life
Learners match real seeds with the corresponding names of fruits and vegetables. They answer discussion questions, and glue the seeds on the correct squares of a chart.


