Curated OER
Interpreting Statistics: A Case of Muddying the Waters
Is river pollution affecting the number of visitors to Riverside Center, and is the factory built upstream the cause of the pollution? Let your class be the judge, literally, as they weigh the statistical evidence offered by the factory...
Teach Engineering
A Good Foundation
It takes a strong foundation to build a house and a stronger one for a bridge. This resource presents the effects of geology and soil on bridge foundations. Working in groups, the class investigates the interaction of shallow and deep...
University of Colorado
Looking Inside Planets
Researchers use scientific data to understand what is inside each of the planets. The first in a series of six, this instructional activity builds off of that concept by having pupils use a data table to create their own scale models of...
EngageNY
Newton’s Law of Cooling, Revisited
Does Newton's Law of Cooling have anything to do with apples? Scholars apply Newton's Law of Cooling to solve problems in the 29th installment of a 35-part module. Now that they have knowledge of logarithms, they can determine the decay...
Radford University
How Normal Are You?
It's completely normal to learn about normal distributions. An engaging lesson has young statisticians collect and analyze data about their classmates as well as players on the school's football team. They determine whether each set of...
Curated OER
The Game is Afoot - A Study of Sherlock Holmes
Mystery is an exciting genre for young readers to investigate. The plots are so intriguing! Here is a series of lessons featuring Sherlock Holmes stories that invite learners to enter the world of the mystery genre. Based on what they...
Curated OER
Raisin the Statistical Roof
Use a box of raisins to help introduce the concept of data analysis. Learners collect, analyze and display their data using a variety of methods. The included worksheet takes them through a step-by-step analysis process and graphing.
Curated OER
Box Plots
Young statisticians are introduced to box plots and quartiles. They use an activity and discussion with supplemental exercises to help them explore how data can be graphically represented.
Curated OER
Frost Depth Study
Young scholars complete activities to study the frost and frost depth. In this frost study lesson, students use frost tubes to study and measure the frost at their school. Young scholars measure the frost in the tube and enter their data...
Curated OER
Probability
Ninth graders engage in a lesson that is about the concept of probability using the context of recording data and predicting outcomes. They collect marbles while recording data and graphing it. The graph is analyzed and ideas are...
Curated OER
Science: Backyard Bugs Data Collection
Students practice data collection skills by observing common bugs found in their local environment. Once the data is collected they complete data sheets to compare, contrast, sort, and classify the insects. The lesson includes...
Curated OER
Mean, Median and Mode
Young statisians work with sets of data. They find mean, median and mode, and discuss the effects of outliers on the data set.
Curated OER
How Much is There to Eat?
Students examine food production related to population density. In this interdisciplinary lesson, students gather data regarding food production in the American South and in India. Students follow the outlined steps to calculate the...
Curated OER
How Many?
Young scholars investigate concepts related to data collection and interpretation. They generate all possible outcomes in a beginning study in the realm of statistics. The use of real life situations helps to engage students.
Curated OER
And You Thought Gasoline Was Expensive!
Students carry out a cost analysis. In this comparative math lesson, students compare the cost of equal measures of gasoline to mouthwash, house paint, fruit juice, white-out, and other liquids.
Curated OER
Sex Stereotypes in Society
Students analyze a collection of advertisements or photographs in a text or magazine and identify the stereotypes used or possible biases of the editors. They discuss how these stereotypes are formed, and the ways in which they impact...
Curated OER
Go Fish!
Learners collect data, interpret data summarize proportional reasoning. Students determine (with various alternate goods) the number of fish in a nearby pond. Learners capture the goldfish crackers, deal with pretzels and then write...
Pennsylvania Department of Education
Multiplication Represented as Arrays
Third graders collect data about themselves and use in a line plot. In this analyzing data instructional activity, 3rd graders collect various sets of information,create a line plot and compare the data. Students complete a worksheet on...
Curated OER
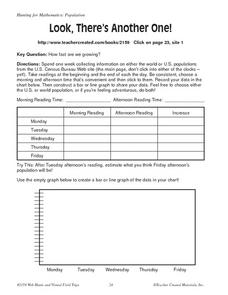
Look, There's Another One!
In this math worksheet, learners spend a week collecting information on either the word or U.S. populations from the U.S. Census Bureau Web site. Students record their data in a chart and bar graph. Learners also use the website to...
Curated OER
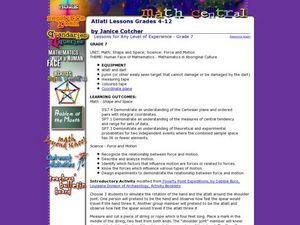
Atlatl Lessons for Grade 7
Seventh graders examine force and motion. In this seventh grade mathematics/science lesson, 7th graders collect and analyze data regarding the use of an atlatl to throw a spear. Students describe and analyze the motion which leads to the...
Curated OER
Statistics Newscast in Math Class
Students study sports teams, gather data about the teams, and create a newscast about their data. In this sports analysis instructional activity, students research two teams and define their statistical data. Students compare the two...
Curated OER
Pumpkin Seed Data!
Second graders work with pumpkins to estimate, then accumulate data about pumpkin seeds. After cleaning out the pumpkins, 2nd graders utilize a worksheet imbedded in this plan which has a variety of pumpkin math activities they can do.
Curated OER
Beginning Modeling for Linear and Quadratic Data
Students create models to represent both linear and quadratic equations. In this algebra lesson, students collect data from the real world and analyze it. They graph and differentiate between the two types.
Curated OER
M & Ms in a Bag
Students make predictions about the number and colors of M&M's in a snack size package. They create an Excel spreadsheet to record the data from their small group's bag, create a graph of the data, and discuss the variations of data...


