Curated OER
Monopoly Graphs
Students relate the concepts of linear functions to the game of monopoly. For this algebra lesson, students solve problems with ratio and proportion. They collect data and graph it.
Curated OER
Excel temperature Graphs
Students gather data about the weather in Nome, Alaska. In this Nome Temperature lesson, students create an excel graph to explore the weather trends in Nome. Students will find the average weather and add a trend line to their graph.
Curated OER
How Trees Contribute to the Water Cycle
In this water cycle instructional activity, 3rd graders conduct an experiment where they observe and calculate how water transpires in different types of trees. Students engage in a class discussion and use Venn Diagrams to compare...
Curated OER
Trajectory Perplexity
Students investigate measuring angles correctly through projectiles. For this geometry lesson, students launch a projectile to investigate the importance of how to measure an angle correctly and to explore trajectory. They collect data...
Curated OER
Probability and Expected Value
Students collect data and analyze it. In this statistics lesson, students make predictions using different outcomes of trials.
Curated OER
Measurement Mix-Up
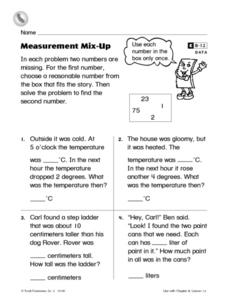
For this measurement worksheet, 2nd graders read 4 word problems and find the two numbers missing in each one. Students choose a reasonable number from the box that fits the story for the first number and then solve the problem to find...
Curated OER
Will It Sink or Float?
Students perform experiments to see if items will sink or float. In this sink or float lesson, students work in groups to make predictions, and record the results. After the experiments are complete students make a book of the results.
Curated OER
Scatter Plots
Seventh graders investigate how to make and set up a scatter plot. In this statistics lesson, 7th graders collect data and plot it. They analyze their data and discuss their results.
Curated OER
The Apple Orchard Problem
Students explore various approaches to solving a problem of maximizing the total production of apples in an orchard. In this apple orchard lesson, students collect data in order to solve the apple orchard problem presented. Students plot...
Curated OER
Teaching fractions & ratios with M&Ms
Students collect data using M&Ms, fill in charts, and write ratios and fractions for each color M&M.
Curated OER
Hopes and Dreams: A Spreadsheet Lesson Using Excel
Fourth graders read "The Far Away Drawer" by Harriet Diller and discuss the story as a class. After discussion, 4th graders create a t-shirt GLYPH about their hopes and dreams,share their information with the class and create spreadsheets.
Curated OER
Measure Twice
Learners measure a variety of objects using the appropriate measuring tool. In this measurement lesson, students explain the importance of accuracy and precision in collecting data. They discuss the difference between the two.
Curated OER
Excel Lesson
Fifth graders will perform exercises and write the number of each exercise performed on the collection data sheet. They survey eight of their classmates for their exercise data and write that data on the collection data sheet. They then...
Curated OER
Discovering Ohm's Law
Connect math with science! Pupils apply properties of Ohms Law as they solve problems and identify the inverse relationship of a function. They analyze the shape of the graph of an inverse function and use it to make predictions.
Curated OER
Coming to Know F and C
Students collect temperatures using a probe and examine data. In this temperature lesson students complete an activity using a graphing calculator.
Curated OER
Prairie Math
Students work together to build models of prairie plants. Using the model, they estimate the height and then measure them using metric and standard units. They write a fraction to represent their part of the whole set and compare and...
Curated OER
"You're Hired!'
Students investigate linear programming using the TI. In this algebra lesson, students collaborate and graph linear inequalities on a TI. They analyze their data and present it to the class.
Pennsylvania Department of Education
Eye to Eye
Students practice the concept of posing mathematical questions regarding themselves and their surroundings. In this eye to eye lesson, students gather data about eye color from their classmates. Students organize their data in order to...
Curated OER
What Do You SUBpose?
Submarines are the fous of this math and science lesson. In it, learners explore the world of submarines: how they work, and what they are used for. They engage in hands-on activities, watch video clips, and work in cooperative groups in...
Curated OER
Mathemafish Population
It's shark week! In this problem, young mathematically minded marine biologists need to study the fish population by analyzing data over time. The emphasis is on understanding the average rate of change of the population and drawing...
Curated OER
Quadratic Equations with the CBL 2
Learners practice generating parabolas with a motion sensor while determining the vertex form of the equation. They compare it to the regression equation from the calculator onto a data mate software. Each student completes several...
Curated OER
Winter-time Temps
Students measure temperature and become aware the the temperature above and below the snow is different. In this winter temperature lesson, students measure temperatures to find variation based on how the snow is packed. Students create...
Curated OER
Barbie Bungee
Middle and high schoolers collect and analyze their data. In this statistics lesson, pupils analyze graphs for linear regression as they discuss the relationship of the function to the number of rubber bands and the distance of the...
EngageNY
Ruling Out Chance (part 1)
What are the chances? Teach your classes to answer this question using mathematics. The first part of a three-day lesson on determining significance differences in experimental data prompts learners to analyze the data by determining the...


