Curated OER
Spreading Doom
Students explore the pattern created by a sequence or series. For this geometry lesson, students relate the spread of a virus to the growth of exponential functions. They collect data as they analyze the sequence created by the growth.
Curated OER
Using the Balance
Students determine the mass of various objects. In this integrated math and science lesson, students use an arm balance to compare a known object to a combination of washers with a fixed weight. Students record data, construct a bar...
Curated OER
Graphing
Students collect data and graph their results, then analyze the graphs. In this geometry lesson, students examine slopes and their graphs and discuss the relationship between the lines and the slopes.
Curated OER
Conditions at Sea Introductory Activity, Making Waves
Students explore waves and wind. In this physical and earth science wave instructional activity, students participate in a wave making activity with an aquarium and a hair dryer. Students complete a data chart recording wave height and...
Curated OER
Biological and Agricultural Engineering
Eighth graders explore mathematics by conducting a series of investigations using a colorimeter. In this math lesson, 8th graders explain the purpose of food irradiation. They collect data and graph them.
Curated OER
Graphing
Learners investigate graphing. In this bar graph lesson, students view an informational website about graphing, then construct a class birthday bar graph outside with sidewalk chalk. Learners choose a survey topic, then collect data and...
Curated OER
Animal Skin
Students investigate the skin surface to body area ratios for different animals. In this seventh/eighth grade mathematics/science lesson, students explore heat transfer between an animal’s body and the environment. Using technology,...
Curated OER
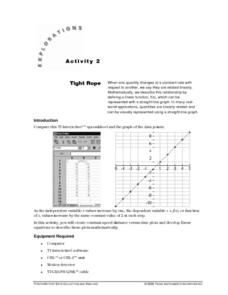
Tight Rope
Learn how to explore the concept of linear functions. In this linear functions lesson, students collect linear data from a motion detector. Students walk to create a linear function. Students plot the points on a graph and determine a...
Curated OER
TI Workshop Presentation Guide for "Preparing for Proofs"
Pupils discover proofs using the TI in this geometry lesson. They collect data from newspaper and magazines and analyze their data using the TI, relating it to proofs.
Curated OER
Mean Median and Mode
Students collect data, graph it and analyze it. In this statistics lesson plan, students plot their data and calculate the mean, median and mode explaining how it relates to the data. They define the ways to find the mean, median and mode.
Curated OER
Graphing Surveys
Students collect data and graph it. In this algebra lesson, students create a survey for their classmates and teachers. They analyze the results from the survey and graph it. They draw conclusion from their data based on the graph.
Curated OER
Graph the Presidents At Inauguration- How Old Were They?
Learners construct a graph of the presidents' ages at inauguration. In this U.S. history instructional activity, students use online resources to gather data about the presidents and accurately present their results on a graph.
Curated OER
Applied Science - Built Environment Lab
Young scholars evaluate trash. For this Science lesson, students collect and weigh trash from their classrooms. Young scholars categorize the trash and the corresponding weights, recording the information on a data sheet.
Curated OER
Taste
Young scholars collect data to be used in selecting the class favorite taste. They predict which among the common flavors such as salty, sweet, sour, or bitter is preferred.
Curated OER
Positive Future Fair Project
Ninth graders view the film "Pay It Forward" and discuss what kind of public campaign is needed to move people to positive action. They consider different ways of presenting information (graphs, visual displays, etc.) as tools for...
Curated OER
Recycled Racers
Pupils research automobile operating systems in relation to racing. They design and construct vehicles from recycled material which they race to study the concept of propulsion.
Curated OER
Graphing Family Reading Habits
Second graders collect data from their families about their reading habits and graph them. In this graphing family reading habits instructional activity, 2nd graders interview family members about their reading habits. They then use a...
Curated OER
Velocity
Students explore the concepts of velocity, acceleration, distance and football. They collect data on the velocity of a football and they determine the distance and height of a football when it is thrown. Students compare their findings...
Curated OER
Plastic Packaging
Students collect data. In this math instructional activity, students collect data about recyclable materials. Students develop a plan that will help the environment. Recycling plastic containers is discussed.
Curated OER
Jumping to Conclusions
Students decide as a class what their data is going to be to graph. In this math lesson, students organize data so that it will be easier to display in a graph. Students are guided through the process by their teachers, and helped with...
Curated OER
Gender and Income
Students investigate Income and gender preference. In this statistic lesson, students collect data of Income to see if one gender makes more than the other. Students examine the data and draw conclusions.
Curated OER
How Much Is Too Much?
Learners examine population growth and collect data. In this statistics lesson, students create a scatter plot to represent the different species found in the water and are being harvested. They graph their data and draw conclusion from it.
Curated OER
Lesson Plan
Eleventh graders will read, write, listen, and speak for information and understanding Key Idea: As listeners and readers, 11th graders will collect data, facts, and ideas, discover relationships, concepts, and generalizations. As...
Curated OER
Collecting and Organizing Data
Fifth graders explore methods of generating and organizing data. Afterward, they visit a specified website where they analyze data, organize, and create graphs. Students follow instructions and complete answers to questions. They...


