Statistics Education Web
Now You SeeIt, Now You Don't: Using SeeIt to Compare Stacked Dotplots to Boxplots
How does your data stack up? A hands-on activity asks pupils to collect a set of data by measuring their right-hand reach. Your classes then analyze their data using a free online software program and make conclusions as to the...
University of Exeter
Angles and Turns
Junior geometers investigate the concepts of angles and turns using straws to perform a hands on activity. This is helpful for kinesthetic learners who have a hard time with mathematics. The lesson plan includes the dialogue to be used...
Shodor Education Foundation
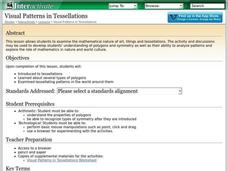
Visual Patterns in Tessellations
Geometers explore the concept of tessellations. They use a tessellation applet to manipulate shapes and design their own tessellation using the applet.
Curated OER
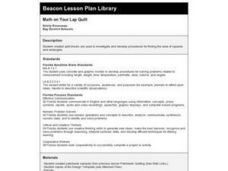
Math On Your Lap Quilt
Get creative juices flowing when you allow groups to figure out a procedure for how to find the area of squares and rectangles. They may use the individual patchwork blocks, or they may design one using the Design Template.
National Security Agency
Partying with Proportions and Percents
Examine ratios and proportions in several real-world scenarios. Children will calculate unit rates, work with proportions and percentages as they plan a party, purchase produce, and take a tally. This lesson plan recommends five...
Curated OER
Decimals Decide Olympic Champions
The class discovers how a decimal can make all the difference in the Olympics. As they learn about decimal place values, they compare and contrast data and demonstrate decimal values using manipulatives.
Curated OER
Telling Time, Part 2
Compare time on an analog clock and a digital clock with a learning exercise that prompts third graders to write the given times into both clocks. An example at the top of the page demonstrates how to write the time for both clocks. A...
EngageNY
Describing a Distribution Displayed in a Histogram
The shape of the histogram is also relative. Learners calculate relative frequencies from frequency tables and create relative frequency histograms. The scholars compare the histograms made from frequencies to those made from relative...
DK Publishing
Tall, Taller, Tallest
Reinforce relative size and following directions. After looking at a small bottle and flower, kindergartners draw a taller version of each in the circle provided. They then choose the tallest building out of five. Bring the lesson to...
Teach Engineering
Viscous Fluids
Elasticity and viscosity. Help your class understand the similarities and differences with an introduction to viscous fluids. After describing four types of fluid behaviors: shear thinning, shear thickening, Bringham plastic, and...
Kenan Fellows
Density
Most scholars associate density with floating, but how do scientists determine the exact density of an unknown liquid? The third lesson in a seven-part series challenges scholars to find the mass and volume of two unknown liquids. Each...
Curated OER
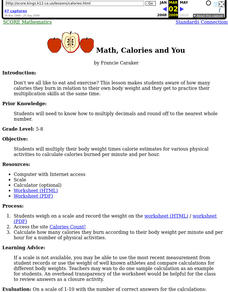
Math, Calories and You
Discover the connection between calories and weight. Pupils multiply their body weight times calorie estimates for various physical activities to calculate calories burned per minute and per hour. Worksheets a well as website links are...
American Statistical Association
A Sweet Task
Candy is always an effective motivator! A fun math activity uses M&M's and Skittles to explore two-way frequency tables and conditional probability. The candy can serve a dual purpose as manipulatives and experimental data.
Mathematics Assessment Project
Modeling Motion: Rolling Cups
Connect the size of a rolling cup to the size of circle it makes. Pupils view videos of cups of different sizes rolling in a circle. Using the videos and additional data, they attempt to determine a relationship between cup measurements...
Noyce Foundation
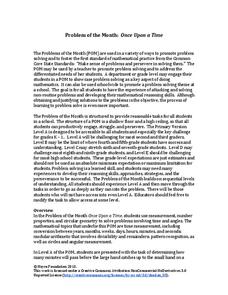
Once Upon a Time
Examine the relationship between time and geometry. A series of five lessons provides a grade-appropriate problem from elementary through high school. Each problem asks learners to compare the movement of the hands on a clock to an angle...
Statistics Education Web
You Will Soon Analyze Categorical Data (Classifying Fortune Cookie Fortunes)
Would you rely on a fortune cookie for advice? The lesson first requires future statisticians to categorize 100 fortune cookie fortunes into four types: prophecy, advice, wisdom, and misc. The lesson goes on to have learners use...
Science Matters
Finding the Epicenter
The epicenter is the point on the ground above the initial point of rupture. The 10th lesson in a series of 20 encourages scholars to learn to triangulate the epicenter of an earthquake based on the arrival times of p waves and s waves....
Mascil Project
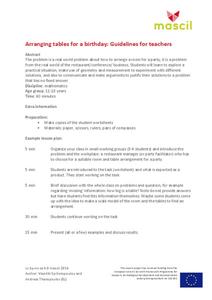
Arranging Tables for a Birthday
Planning a party of 45 guests may be more complicated than it would seem. Learners must design the space in accordance with these constraints about the space available in the room. They need to calculate area, circumference, and linear...
American Statistical Association
Bubble Trouble!
Which fluids make the best bubbles? Pupils experiment with multiple fluids to determine which allows for the largest bubbles before popping. They gather data, analyze it in multiple ways, and answer analysis questions proving they...
Houghton Mifflin Harcourt
Use a Graph: Measure Fish
Something's fishy here! Use the bar graph provided to determine the length of each fish shown. Small cartoon fish make this an engaging worksheet for young learners. There are six questions provided.
Curated OER
Rescue Mission Game
Students conduct probability experiments. For this rescue mission lesson plan, sudents play a game and collect statistical data. They organize and interpret the data and determine the probability of success. Students plot points on a...
Curated OER
Piecewise Linear Functions: Extending Stories to Graphs
Using this resource, scholars develop graphs that model situations by showing change over time. They answer 15 questions based on information from charts that show growth in weight. They extend the concepts to an assessment section of...
Statistics Education Web
The Case of the Careless Zookeeper
Herbivores and carnivores just don't get along. Using a box of animal crackers, classes collect data about the injury status of herbivores and carnivores in the box. They complete the process of chi-square testing on the data from...
Curated OER
Volume of Pyramids and Cones
High schoolers find the volume of pyramids and cones. In this volume of pyramids and cones lesson, learners explore the relationship between the volumes of prisms and pyramids. They investigate the relationship between pyramids and cones.


