Government of Hong Kong
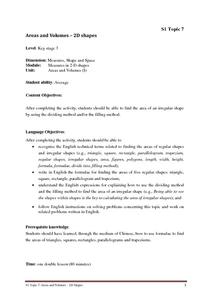
Areas and Volumes - 2D Shapes
Unfortunately for young mathematicians, the world isn't made entirely of parallelograms, triangles, and trapezoids. After first learning the area formulas for these common shapes, students apply this new knowledge to determine the area...
Agriculture in the Classroom
Making Half MyPlate Fruits and Vegetables
Establish healthy eating habits with a lesson focused around MyPlate's food recommendations and the importance of eating fruits and vegetables. Through class discussion and worksheet completion, scholars discuss the best choices of foods...
Curated OER
Math, Fractions, and Music
Students discover the relationship between musical rhythms and fractions. They add musical notes together to produce fractions and create addition and subtraction problems with musical notes. Students complete worksheets and create their...
Curated OER
Representing Data 1: Using Frequency Graphs
Here is a lesson that focuses on the use of frequency graphs to identify a range of measures and makes sense of data in a real-world context as well as constructing frequency graphs given information about the mean, median, and range of...
EngageNY
Describing Center, Variability, and Shape of a Data Distribution from a Graphical Representation
What is the typical length of a yellow perch? Pupils analyze a histogram of lengths for a sample of yellow perch from the Great Lakes. They determine which measures of center and variability are best to use based upon the shape of the...
EngageNY
Two Graphing Stories
Can you graph your story? Keep your classes interested by challenging them to graph a scenario and interpret the meaning of an intersection. Be sure they paty attention to the detail of a graph, including intercepts, slope,...
EngageNY
Graphs of Piecewise Linear Functions
Everybody loves video day! Grab your class's attention with this well-designed and engaging resource about graphing. The video introduces a scenario that will be graphed with a piecewise function, then makes a connection to domain...
EngageNY
Logarithms—How Many Digits Do You Need?
Forget your ID number? Your pupils learn to use logarithms to determine the number of digits or characters necessary to create individual ID numbers for all members of a group.
EngageNY
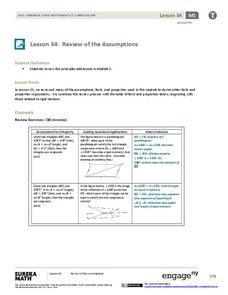
Review of the Assumptions (part 2)
Is the amount of information getting overwhelming for your geometry classes? Use this strategy as a way to organize information. The resource provides a handout of information studied in relation to triangle congruence. It includes a...
Lesson This!
Fraction Fruit
Discover the concept of fractions by using fruit as a model. Scholars discover fractions are part of a whole, similar to the pieces of fruit which are placed in front of them. They then cut up several different types of fruit and discuss...
Cornell University
Math Is Malleable?
Learn about polymers while playing with shrinky dinks. Young scholars create a shrinky dink design, bake it, and then record the area, volume, and thickness over time. They model the data using a graph and highlight the key features of...
Curated OER
The Math in the Design and Building of Bridges
Research various types of bridge designs. Your class will be asked to consider what it would be like without bridges while learning about how they work. They will construct a model bridge based on given parameters. They then calculate...
Teach Engineering
Air Pressure
Investigate what is pushing on us. An intriguing activity has pupils calculate the amount of force on various squares due to air pressure. Using the data, individuals create a graph in the third activity of the Up, Up and Away unit...
Kenan Fellows
Farm to Fuel: The Alternative Fuels Industry
Need a activity to fuel young minds? A variety of hands-on activities is sure to get your class fired up! Beginning with an introductory slideshow and culminating with group presentations, the week-long unit has something for everyone....
Teach Engineering
Designing a Spectroscopy Mission
In this mind-bending activity, young engineers explore this question of whether or not light actually bends. Using holographic diffraction gratings, groups design and build a spectrograph. The groups then move on research a problem...
Pace University
Grades 7-8 Mean, Median, and Mode
Take a central look at data. The differentiated lesson provides activities for pupils to calculate central tendencies. Scholars begin choosing three central tendency activities from a Tic-Tac-Toe board. Learners then choose from sports,...
National Museum of Mathematics
Hands-On Data Analysis
Jump at the chance to use this resource. A kinesthetic activity has classmates jumping in several different ways (standing, single-step, and multiple-step jumps) to create handprints on poster paper taped to the wall. They measure the...
Curated OER
Bubblegum Math
Here is a lesson on how to convert inches to centimeters using bubblegum. For this measurement lesson plan, learners get into partners and blow bubbles. One student blows bubbles while the other measures the bubble in inches. Then the...
Curated OER
Biospheres in Your Backyard
Students collect data from a local river biome. They use the information for metric conversion and graphing equations. They study the components of what makes up a biosphere and how math is used to analyze one.
Curated OER
Measuring the Diameter of the Sun
Ninth graders study the sun and its distance from Earth. In this Sun's diameter lesson plan students examine how measurement data permits accurate measurement of the sun's diameter.
Curated OER
Mass Measurement
Middle schoolers explore geometry by completing a physics activity on-line. In this mass measurement lesson, pupils define the terms mass, volume, and density and identify their relationship with each other. They complete an on-line...
Curated OER
Food Math
Pupils brainstorm healthy food choices. In this health science lesson, students calculate how much of each food group they need daily. They plan a menu based on the "MyPyramid for Kids" food guide.
Curated OER
Heart Smart in a Heart Beat
As an introductory activity, young statisticians measure their heart rate at rest and after exercise and compute the mean and median, and create a box & whisker plot. This is followed by watching a video (that no longer seems to...
Curated OER
The Consumer Price Index: A Measure of Inflation
Students examine inflation over the years and learn to calculate how it changes over time. In this money management lesson plan, students learn how price changes affect their purchasing power, how to come up with strategies for dealing...


