Curated OER
Around the Clock
Middle schoolers discover the relationship between the circumference of a circle and its diameter. They find the length of an arc of a circle.Students use estimation strategies in real-world applications to predict results (i.e.,...
Shodor Education Foundation
Sets and the Venn Diagram (Beginner)
Venn diagrams are helpful in understanding the idea of a set and using attributes to sort items. This basic plan is an introduction with an added bonus of an applet that can be used to demonstrate the activity. If a classroom of...
Statistics Education Web
10,000 Steps?
Conduct an experiment to determine the accuracy of pedometers versus pedometer apps. Class members collect data from each device, analyze the data using a hypothesis test, and determine if there is a significant difference between the...
Bowland
DanceStar
Express dance moves mathematically. Scholars dissect dance routines and express them using mathematical notation, such as translations and rotations. They use video clips to investigate seven different dance genres.
EngageNY
Interpreting and Computing Division of a Fraction by a Fraction—More Models II
No more inverting and multiplying to divide fractions. Applying concepts of measurement division from the previous lesson plan, pupils consider partitive division using fraction bars and number lines. They first convert fractions to like...
Beyond Benign
Ecological Footprint
How does your lifestyle measure up in terms of your ecological footprint? Young ecologists examine their impact on the planet using an insightful online calculator. A short quiz asks users to rank the size of their homes, their energy...
Curated OER
Kernel Count!
Here is an impressive and thorough lesson on estimation. Young mathematicians estimate how many kernels of popcorn can fit in a tablespoon, then how many tablespoons of kernels can fit in a baby food jar. The popcorn is then popped. All...
EngageNY
Determining the Equation of a Line Fit to Data
What makes a good best-fit line? In the 10th part of a 16-part module, scholars learn how to analyze trend lines to choose the best fit, and to write equations for best-fit lines to make predictions.
EngageNY
Magnitude
Build an understanding of the powers of 10. Pupils investigate the results of raising 10 to positive and negative powers. They relate this understanding to the magnitude these powers represent in this seventh lesson of 15.
University of Georgia
Using Freezing-Point Depression to Find Molecular Weight
Explore the mathematical relationship between a solvent and solute. Learners use technology to measure the cooling patterns of a solvent with varying concentrations of solute. Through an analysis of the data, pupils realize that the rate...
EngageNY
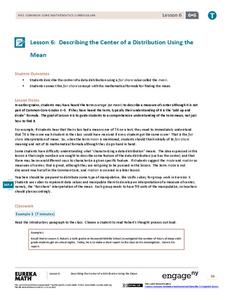
Describing the Center of a Distribution Using the Mean
Everyone does their fair share. The sixth segment in a 22-part unit presents the mean as a fair share. Groups build a conceptual understanding of the mean of a data set, rather than simply learn an algorithm. Learners use the...
Curated OER
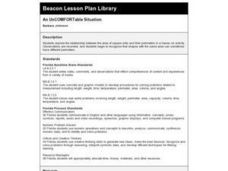
An Uncomfortable Situation
If shapes have the same area, do they always have the same perimeter? Learners explore the relationship between the area of square units and their perimeters in a hands-on activity. Observations are recorded, and they begin to recognize...
Curated OER
Getting it Right! An Investigation of the Pythagorean Theorem
In order to learn about the Pythagorean Theorem, young mathematicians investigate relations and patterns between different sides of a right triangle to look for possible relations among the squared sides. Once they have established the...
Curated OER
Converting Between Units
Upper graders practice using measurements by solving conversion problems. There are given different time or measurement increments and must convert them to a larger or smaller increment. They also utilize a calculator and conversion...
West Contra Costa Unified School District
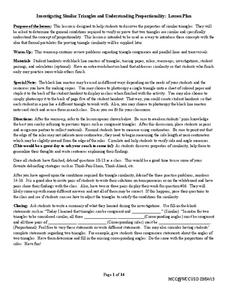
Investigating Similar Triangles
Let your use of the resource be in proportion to its usefulness. Pupils investigate similar triangles by measuring side lengths and considering given angle measures. The results of the investigation help develop generalizations about...
Curated OER
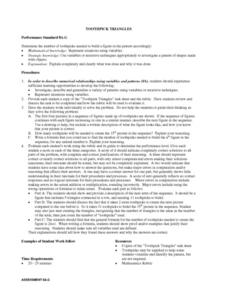
Toothpick Triangles
Learners draw a chart (included in the lesson) to use with their investigation. They review terminology of triangles and receive toothpicks to use in the lesson. Beginning with three toothpicks, students form a triangle. They complete...
Texas Instruments
Properties of Parabolas
Explore the properties of parabolas in this lesson. Construct a parabola given a focus and a directrix on the Ti-Nspire. Write equations of parabolas in vertex form and determine the a value of a parabola given a focus and directrix.
EngageNY
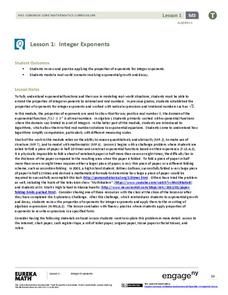
Integer Exponents
Fold, fold, and fold some more. In the first installment of a 35-part module, young mathematicians fold a piece of paper in half until it can not be folded any more. They use the results of this activity to develop functions for the area...
Curated OER
Too Heavy For Me
Students explore the different arrangement of air molecules in high and low air pressure masses. They compare the temperature of high and low pressure masses and discover how a barometer works.
Curated OER
The Three M's of Statistics: Mode, Median, Mean
Young mathematicians use the Visual Thesaurus to define mean, median, and mode. In this mean, median and mode activity, learners use online sources to find the definitions of mean, median, and mode before applying the concepts to a class...
Curated OER
Cold, Clouds, and Snowflakes
Students explore satellite data and graphing. In this weather data analysis math and science lesson, students analyze NASA satellite data to draw conclusions about geographical areas where precipitation might have happened. Students...
West Contra Costa Unified School District
Parallel Lines Cut by a Transversal
Parallel lines seem so right for each other. It's too bad they'll never, ever meet. Learners use tracing paper to discover relationships among angles formed by two parallel lines cut by a transversal. They apply this information to find...
Curated OER
Penny Basketball: Making Sense of Data
Explore four web-based interactive sites to develop a baseline understanding of statistics. Learners play a series of penny basketball games and collect data regarding their shooting statistics. Groups decide who is the "top" penny...
Curated OER
Transformations and Matrices
There are four activities in this extensive lesson covering the identity matrix and scaling, the linear representation of translations, the linear representation of rotations, and reflections. In small groups, they use the Cabri II...


