Curated OER
Fuel Cell Experimentation
With rising oil prices and increasing concerns over global warming, the pressure is on for engineers to develop alternative sources of energy. Among the new technologies being developed are hydrogen fuel cells, which young scientists...
Statistics Education Web
Saga of Survival (Using Data about Donner Party to Illustrate Descriptive Statistics)
What did gender have to do with the survival rates of the Donner Party? Using comparative box plots, classes compare the ages of the survivors and nonsurvivors. Using the same method, individuals make conclusions about the gender and...
Curated OER
Penny Basketball: Making Sense of Data
Explore four web-based interactive sites to develop a baseline understanding of statistics. Learners play a series of penny basketball games and collect data regarding their shooting statistics. Groups decide who is the "top" penny...
Curated OER
Transformations and Matrices
There are four activities in this extensive lesson covering the identity matrix and scaling, the linear representation of translations, the linear representation of rotations, and reflections. In small groups, they use the Cabri II...
Curated OER
Skate Borders
Elementary schoolers explore how making different rectangular shapes with the same perimeter has an affect on the area of those shapes. Learners use the worksheet embedded in the plan to design their own skateboarding track. They use...
Curated OER
What's the Frequency, Roy G. Biv?
Introduce starting space scientists to the electromagnetic spectrum, expecially the portion of visible light. Teach them about wavelength and frequesncy. Then give them a roll of adding machine tape and a manila folder to make a...
Baylor College
Lungometer
Life science learners construct lung-o-meters from gallon-sized milk jugs and then measure their lung capacities. For older students, have them graph the vital lung capacities of each person in the class. Cross-curricular pieces are...
Shodor Education Foundation
Algorithm Discovery with Venn Diagrams
Here is a lesson that takes an interesting approach to analyzing data using box and whisker plots. By using an applet that dynamically generates Venn diagrams, the class forms a strategy/algorithm for guessing the rule that fits the...
Curated OER
Sun and Shadows
Why do shadows look different in the summer than in the winter? What causes day and night? How can a sundial be used to tell time? Answer these questions and more through two engaging lessons about light and shadows. Fourth and fifth...
Statistics Education Web
How Wet is the Earth?
Water, water, everywhere? Each pupil first uses an Internet program to select 50 random points on Earth to determine the proportion of its surface covered with water. The class then combines data to determine a more accurate estimate.
Space Awareness
How To Travel On Earth Without Getting Lost
Have you ever wanted to travel the world? Take a virtual trip with a geography lesson that uses longitude and latitude, the position of the sun, an astronomy app, and a classroom globe.
Curated OER
Fantastic Fraction Fudge
In order to create some tasty fudge, learners must adapt a recipe. Using a recipe for fudge, ingredients must be correctly converted using fractions. If one fraction is incorrect, the fudge will reveal it! Although you will only make one...
Ohio Department of Education
Describing and Creating Plane Figures - Grade One
Young mathematicians draw, create, and describe different shapes using triangles. They discuss attributes of the original and created shapes. Pupils classify the created shapes and draw and write in mathematics journals to communicate...
Curated OER
Weave a Wreath
Students follow directions to complete a multi-step process that results in an attractive holiday decoration. In this Christmas art activity lesson, students employ simple measuring and weaving techniques and experiment with the negative...
Baylor College
How Much Water Do Humans Need?
Physical or life science learners measure the amounts of water eliminated by intestines and the urinary system, and the amounts lost via respiration and perspiration. In doing so, they discover that the body's water must be replenished...
Curriculum Corner
Guest Teacher Plans: Grade 6
Taking a day off of school can feel like a lot more work than going because of the time and effort that goes into making sub plans. Make your life easier with a daily plan for a guest teacher designed to meet the needs of sixth graders...
Curated OER
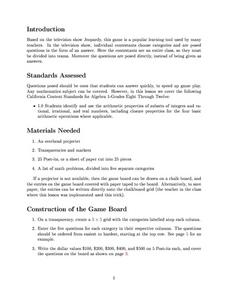
Mathematical Jeopardy
Middle schoolers use the popular game of Jeopardy to explore different mathematical concepts. They are highly engaged with the use of technology for this lesson. They function using higher-order thinking skills in order to create their...
EngageNY
Estimating Probability Distributions Empirically 2
Develop probability distributions from simulations. Young mathematicians use simulations to collect data. They use the data to draw graphs of probability distributions for the random variable in question.
Curated OER
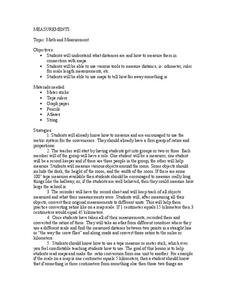
Math and Measurement
Young scholars use the correct tool to measure distances. In this geometry instructional activity, students use an odometer and ruler correctly as they study maps. They describe how far way something is.
Curated OER
Liquid Measurement
Students explore liquid measurement. In this liquid measurement lesson, students discover the formulas for conversion. Students are given problems and use the formula to convert the measurements.
Curated OER
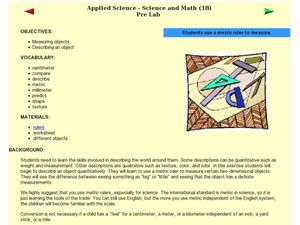
Using a Metric Ruler
Pupils explore measuring with metric rulers. In this math lesson plan, students measure two-dimensional objects using metric units.
Curated OER
Making Simple Conversions
Fourth graders explore unit conversions. They create visual models of measurement units, identify tables of equivalent units and make simple conversions with in a measurement system. Students produce charts that identify units of measure...
Curated OER
What's the Matter with My Snow?
Students collect snow samples around their school. They explore the concepts of density and phase change as well as the math skills of measurement and statistics. Students explore the water cycle through an interactive, down loadable...
Center of Excellence for Science and Mathematics Education
A Sick Astronaut
Aspiring astronauts graph, interpret, and analyze data. They investigate the relationship between two variables in a problem situation. Using both graphic and symbolic representations they will grasp the concept of line of best fit to...


