EngageNY
The Inscribed Angle Alternate – A Tangent Angle
You know the Inscribed Angle Theorem and you know about tangent lines; now let's consider them together! Learners first explore angle measures when one of the rays of the angle is a tangent to a circle. They then apply their newfound...
Curated OER
Exploring Geometry on the Sphere
In this geometry worksheet, students define important vocabulary dealing with circles. They measure cricles to the nearest degree. There are 11 word problems to be solved.
Curated OER
Discovering pi
Tenth graders investigate the history of Pi and how it relates to circles. In this geometry lesson, 10th graders measure the circumference of a circle and the diameter of a circle. They relate these measurements to the number of Pi or 3.14
Curated OER
Planning a Garden Using a Grid
Third graders plan for a garden. In this garden planning lesson, 3rd graders investigate the use of a grid to accurately map out and plan for a vegetable garden. Students predict the space requirements for different vegetables.
Illustrative Mathematics
Toilet Roll
Potty humor is always a big hit with the school-age crowd, and potty algebra takes this topic to a whole new level. Here the class develops a model that connects the dimensions (radii, paper thickness, and length of paper) of a common...
Space Awareness
Britannia Rule the Waves
Could you determine longitude based on measuring time? Early explorers used a longitude clock to do just that. Scholars learn about early exploration and the importance of the invention of the clock. Then pupils build their own longitude...
Science Matters
Richter Scale
The 12th lesson in a series of 20 opens with a demonstration of exponential functions using pasta. This concept is connected to the Richter Scale, which is also an exponential function. Scholars compare the exponential scale that...
Curated OER
Comparison of Univariate and Bivariate Data
Learners explore the concept of univariate and bivariate data. In this univaritate and bivariate data lesson, pupils discuss the differences between univariate and bivariate data. They work sample problems where they must construct box...
Ohio Department of Education
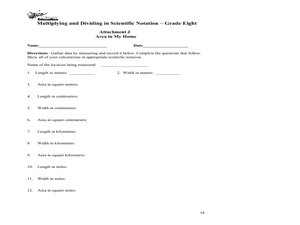
Multiplying and Dividing in Scientific Notation - Grade 8
Here is really nice set of resources on scientific notation. Eighth and ninth graders explore the concept of multiplying and dividing in scientific notation. In this multiplying and dividing numbers in scientific notation instructional...
Shodor Education Foundation
Cross Sections
Use this activity on cross-sections of three-dimensional shapes in your math class to work on algebra or geometry Common Core standards. The instructional activity includes a list of relevent terminology, and a step-by-step process to...
Curated OER
Kernel Count!
Here is an impressive and thorough lesson on estimation. Young mathematicians estimate how many kernels of popcorn can fit in a tablespoon, then how many tablespoons of kernels can fit in a baby food jar. The popcorn is then popped. All...
Bowland
DanceStar
Express dance moves mathematically. Scholars dissect dance routines and express them using mathematical notation, such as translations and rotations. They use video clips to investigate seven different dance genres.
EngageNY
Interpreting and Computing Division of a Fraction by a Fraction—More Models II
No more inverting and multiplying to divide fractions. Applying concepts of measurement division from the previous lesson plan, pupils consider partitive division using fraction bars and number lines. They first convert fractions to like...
EngageNY
Describing Center, Variability, and Shape of a Data Distribution from a Graphical Representation
What is the typical length of a yellow perch? Pupils analyze a histogram of lengths for a sample of yellow perch from the Great Lakes. They determine which measures of center and variability are best to use based upon the shape of the...
Curated OER
Converting Between Units
Upper graders practice using measurements by solving conversion problems. There are given different time or measurement increments and must convert them to a larger or smaller increment. They also utilize a calculator and conversion...
Curated OER
Representing Data 1: Using Frequency Graphs
Here is a lesson that focuses on the use of frequency graphs to identify a range of measures and makes sense of data in a real-world context as well as constructing frequency graphs given information about the mean, median, and range of...
EngageNY
Magnitude
Build an understanding of the powers of 10. Pupils investigate the results of raising 10 to positive and negative powers. They relate this understanding to the magnitude these powers represent in this seventh lesson of 15.
Beyond Benign
Ecological Footprint
How does your lifestyle measure up in terms of your ecological footprint? Young ecologists examine their impact on the planet using an insightful online calculator. A short quiz asks users to rank the size of their homes, their energy...
Curated OER
Getting it Right! An Investigation of the Pythagorean Theorem
In order to learn about the Pythagorean Theorem, young mathematicians investigate relations and patterns between different sides of a right triangle to look for possible relations among the squared sides. Once they have established the...
Curated OER
Patterns in Pascal's Triangle
Young scholars examine the patterns in Pascal's Triangle. In this recognizing lesson, students view a model of Pascal's Triangle and describe the patterns of the multiples. Young scholars identify the shapes that are made within Pascal's...
West Contra Costa Unified School District
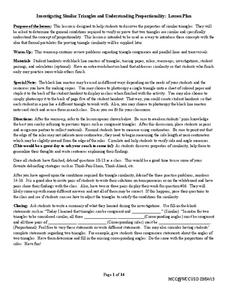
Investigating Similar Triangles
Let your use of the resource be in proportion to its usefulness. Pupils investigate similar triangles by measuring side lengths and considering given angle measures. The results of the investigation help develop generalizations about...
EngageNY
Special Lines in Triangles (part 1)
Allow your pupils to become the mathematicians! Individuals explore the properties of a midsegment of a triangle through construction and measurement. Once they figure out the properties, learners use them to draw conclusions.
EngageNY
Finding a Rate by Dividing Two Quantities
Develop the right station to solve rate word problems. The 18th lesson in a series of 29 starts by interpreting the aspects of rates with two different quantities. Pupils use the interpretation of rates to solve problems, and groups work...
Texas Instruments
Properties of Parabolas
Explore the properties of parabolas in this lesson. Construct a parabola given a focus and a directrix on the Ti-Nspire. Write equations of parabolas in vertex form and determine the a value of a parabola given a focus and directrix.


