Centre for Innovation in Mamatics Teaching
Areas and Perimeters
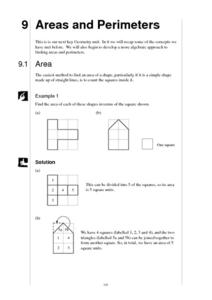
Cover some serious area in your geometry curriculum with this collection of worksheets. After first introducing the concept of area using the tiling method, this resource continues on to teach learners how to use the area and perimeter...
EngageNY
Comparing Distributions
Data distributions can be compared in terms of center, variability, and shape. Two exploratory challenges present data in two different displays to compare. The displays of histograms and box plots require different comparisons based...
Charleston School District
Review Unit 1: Exponents
What will be on the test? The resource provides comprehensive review items for the content of the unit on exponents. The resource divides the sections in the order you present the lessons during the unit.
Ohio Department of Education
Writing and Comparing Numbers in Scientific Notation-Grade Eight
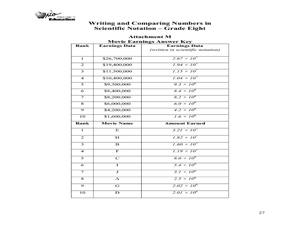
Explore scientific notation in this mathematics lesson plan. Young mathematicians explore multiple representations of large number in scientific notation through the use of models, visual representation and expanded form. The lesson plan...
Charleston School District
Review Unit 2: Congruence and Similarity
Review for the test with a comprehensive list of terms and concepts for the unit on congruence and similarity. It divides divides the sections in the order of the lessons presented during the unit.
Utah Education Network (UEN)
Statistics
Find the value in analyzing data values. Statistics is the focus in the fifth of seven installments of the 6th Grade Math series. Individuals learn to examine dot plots, histograms, and box plots by considering the shape, mean, median,...
Curated OER
Lesson 3.4 Practice A: Theorems and Postulates
In this theorem and postulate worksheet, students identify theorems and postulates that justify given statements. They determine the measure of specified angles. This two-page worksheet contains a total of 37 problems. These two...
Curated OER
Customary Units of Weight
In this customary units of weight worksheet, students use the math table that shows the normal weight of balls used in various professional sports. Students use the numbers in each table to solve the problems.
Computer Science Unplugged
Twenty Guesses—Information Theory
How do we determine how much information to include and what can be left out? By playing a game of 20 questions, the class generates the best strategies for finding a number. They then move on to guessing the next letter in a short...
Willow Tree
Common Geometric Figures
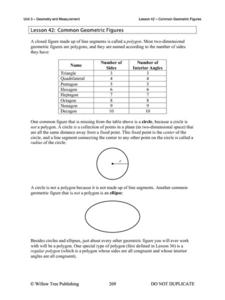
Geometry could be called the study of figures. An overview of the figures found in a typical geometry course contains a study of different triangles, quadrilaterals, and regular polygons.
NASA
Lights on the International Space Station
Groups explore illumination with NASA's Lighting Environment Test Facility (LETF) as a context. Using the TI-Nspire app, groups determine the lux equation that models their simulation. They then use the lux equation to solve problems...
Willow Tree
Angles Formed by Transversals of Coplanar Lines
Create a strong understanding of the relationships formed when parallel lines intersect a transversal. Discuss each type of angle pair and their relationship to each other.
Willow Tree
Box-and-Whisker Plots
Whiskers are not just for cats! Pupils create box-and-whisker plots from given data sets. They analyze the data using the graphs as their guide.
Statistics Education Web
Saga of Survival (Using Data about Donner Party to Illustrate Descriptive Statistics)
What did gender have to do with the survival rates of the Donner Party? Using comparative box plots, classes compare the ages of the survivors and nonsurvivors. Using the same method, individuals make conclusions about the gender and...
Commonwealth of Pennsylvania
Density Worksheet
Find the mass, volume, and density in five different equations with a straightforward worksheet. Each equation prompts kids to work through word problems of varying difficulty and to find the necessary measurement using different formulas.
Curated OER
Narrow Corridor
Buying a new sofa? Learn how to use the Pythagorean Theorem, as well as algebra and graphing techniques, to determine whether the sofa will fit around a corner (which I'm sure you'll agree is a very important consideration!).
Statistics Education Web
How Wet is the Earth?
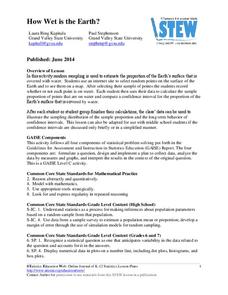
Water, water, everywhere? Each pupil first uses an Internet program to select 50 random points on Earth to determine the proportion of its surface covered with water. The class then combines data to determine a more accurate estimate.
Charleston School District
Solving for a Missing Dimension
If a can has a volume of twelve ounces, how tall it should be? If you can work with volume formulas, it's is an easy measurement to find. After finding the volume of figures in the previous lesson of the series, learners now apply the...
Statistics Education Web
Did I Trap the Median?
One of the key questions in statistics is whether the results are good enough. Use an activity to help pupils understand the importance of sample size and the effect it has on variability. Groups collect their own sample data and compare...
Computer Science Unplugged
Lightest and Heaviest—Sorting Algorithms
How do computers sort data lists? Using eight unknown weights and a balance scale, groups determine the order of the weights from lightest to heaviest. A second worksheet provides the groups with other methods to order the weights. The...
Illustrative Mathematics
Latitude
The greater the latitude, the less of the Earth is north. Scholars graph the relationship between the latitude and the percentage of the Earth that is north of the latitude. Using the graph and the table, class members interpret values...
Mathed Up!
Pie Charts
Representing data is as easy as pie. Class members construct pie charts given a frequency table. Individuals then determine the size of the angles needed for each sector and interpret the size of sectors within the context of frequency....
Center of Excellence for Science and Mathematics Education
A Sick Astronaut
Aspiring astronauts graph, interpret, and analyze data. They investigate the relationship between two variables in a problem situation. Using both graphic and symbolic representations they will grasp the concept of line of best fit to...
Curated OER
Tests for Parallelograms Homework
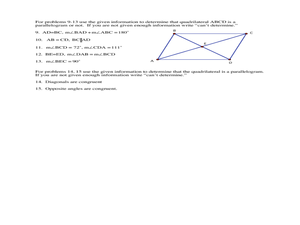
In this test for parallelograms worksheet, students solve 15 short answer problems. Students determine if a given sketch is a parallelogram given angle measures and/or side lengths. Students use knowledge of parallelograms to find...


